All posts by Tom Canfield

What’s a Holding Period and how does that affect your mix of stocks and bonds?

My nephew Rob read last week’s blog. He liked it, but I was not clear enough on the concept of Holding Period and how that affects his choice of mix of stocks and bonds – your choice, too, if you are building your nest egg. The purpose of this post is to explain: What’s a Holding Period and How do I Use Holding Periods to get to a proper mix of stocks and bonds?


== For those in the Save and Invest phase ==


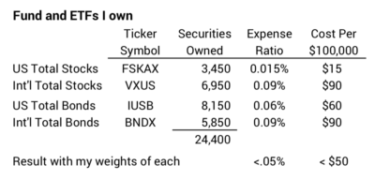
This blog is most useful for those, like Rob, in the Save and Invest phase of life – those building a nest egg. My point in this post is that it makes sense to think through when you will to sell an investment to get the cash you will spend. When you think it through, you have different time horizons. You decide your mix of stocks and bonds for those different time horizons. That’s how you get to your total mix of stocks and bonds.


Most folks just look at their portfolio as one big lump of money without regard to how long parts of it will sit untouched. They’re setting their mix of stocks and bonds for their one big lump. They fret about the ups and downs of the whole lump. This does not make sense to me. Why would I be concerned about what is happening in the stock market now for money that I will not need for spending for decades? Envision your portfolio as divided into groups of Holding Periods, each with a proper mix of stocks and bonds. That’s the way you get to your total mix of stocks and bonds. Also, when you think of your portfolio this way, you’re less alarmed when you see the total decline because you may have parts that have not fallen at all.


== It’s different for us retired folks ==


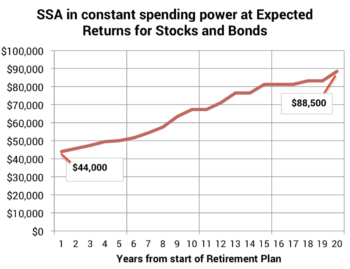
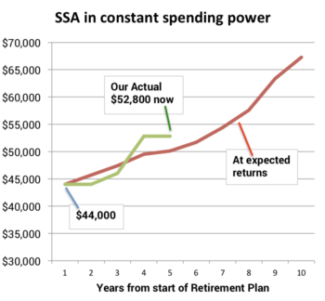
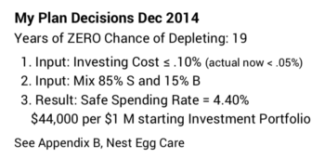
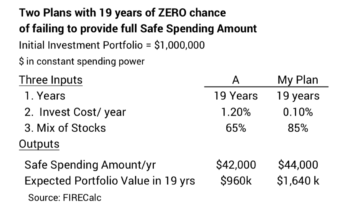
For those of us in the Spend and Invest phase of life, the practical matter is that a Retirement Withdrawal Calculator (RWC) tells us a lot more about what we should have as our mix of stocks and bonds. Rob’s building a nest egg. We retirees are trying to spend from it and not deplete it to an unacceptable level. Decisions for our retirement plan are more complex than for Rob: we have to get to a Safe Spending Rate (SSR%) and we only get that from an RWC (See Nest Egg Care). The thinking on Holding Periods is not precise enough to tell us what’s Safe to Spend, and that’s the biggest factor for safety of our retirement plan.


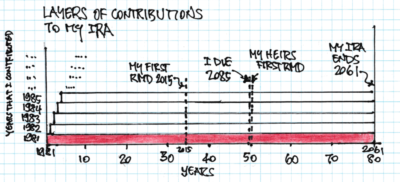
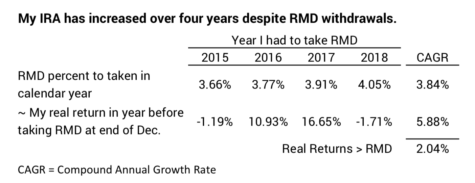
An RWC also tells us how mix (and Investing Cost) affects our portfolio over time. I picked mix for us at the start of our plan and will keep the one I picked for the rest of our lives. Each December, however, I like to recast or envision our portfolio by three Holding Periods. I see the parts are behaving exactly as one would expect.


== What’s a Holding Period ==


A Holding Period is the length of time that you hold onto an investment before you sell it for spending. The most obvious example is the contribution Rob will make – ideally – to his Retirement Account this year – his 401k at work and perhaps also to his Roth or Traditional IRA. Rob is 25. He will not sell securities from his Retirement Account for at least 35 years. Rob’s contribution this year – let’s assume $6,000 – will compound and grow for 35 years. That’s his holding period for this year’s investment. He actually could open an account just for this year’s contribution and nickname it. (This would fit in the nickname space on my Fidelity portfolio page.)


He could open a new account in his master Retirement Account every year and similarly nickname each. It would be clear: each year’s contribution would have at least a 35-year Holding Period. This can get cumbersome, but you get the idea.


Here’s a different one: Rob thinks about his future spending needs and thinks he will spend $20,000 for a new car three years from now. He could actually open an account at his brokerage house – it wouldn’t be part of his Retirement Accounts – and nickname it, “For my new car in summer 2022.” He has some saved now and puts that in this account. He’ll add to that to get to the $20,000. This means the amount he has now has a Holding Period of three years. The amount he adds next month will have a holding period of 35 months. Next is 34 months. And so on. Let’s group all those into one 0-to-3 year Holding Period.


== Long Holding Periods and Mix ==


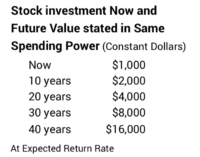
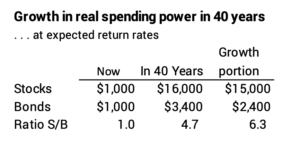
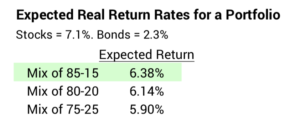
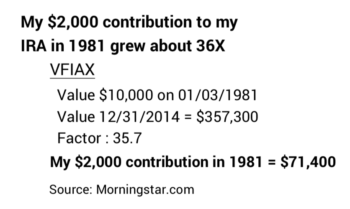
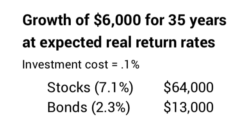
The mix of stocks and bonds for a 35-year Holding Period is really obvious. Over that long of period, nothing will beat stocks. Bonds won’t come close. At expected returns, stocks will pound bonds. Stocks at 7.1% will compound to roughly 11X in spending power. Bonds at 2.3% will compound to roughly 2X.


Both stocks and bonds are variable in returns. Both have had long periods of returns well below their expected return rates. For a 35-year Holding Period, though, bond returns never have surpassed stock returns. The conclusion is clear. Rob’s investment this year into his Retirement Acccount has to be 100% stocks and 0% bonds. His investment next year – with the plan for another 35-year holding period – has to be 100% stocks. The sum of the two is 100% stocks. This pattern repeats for MANY years.


Actually, Holding Periods less than 35 years should be 100% stocks. We whittle the 35 years down in two steps.


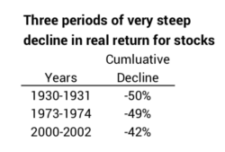
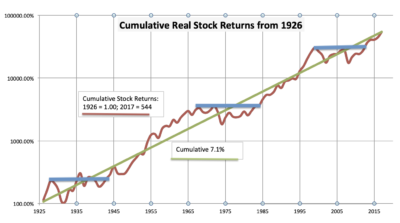
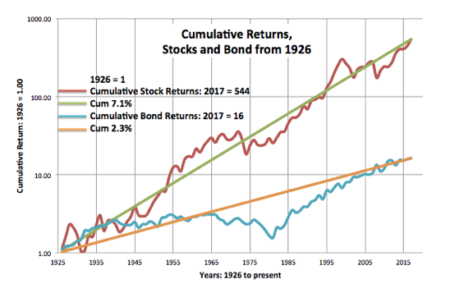
1. We can first cut the years Rob should be 100% stocks in half. At about 17 years – 17-year Holding Period – stocks are LESS variable in return rate than bonds.* You get a sense of this from this graph: historically bonds have departed much farther below their long-term average return line than stocks.


To restate, for a Holding Period of ≥17 years stocks are 3X better in expected annual return and are less variable in annual return rate than bonds. That’s a clear mark: Holding Period ≥17 years HAS to be 100% stocks.


2. Now we get to a judgment on your choice – your bet – for mix of stocks vs. bonds based on less obvious probabilities. I conclude that Holding Periods of 10-years or more should be 100% stocks. The future chances that bonds will outperform stocks for a 10-year holding period is very small. And the amount that bonds may outperform is small. All the other times – when bonds don’t outperform – stocks will compound to much greater value than bonds.


Stocks don’t always outperform bonds over ten-year Holding Periods. Historically bonds have outperformed stocks over ten years about 20% of the time. But most all these occasions occurred in periods from the 1980s when inflation fell from its high of 13% to about 2%. Bond prices move opposite to the direction of interest rates. Prices of bonds rose dramatically with that dramatic fall in interest rates. You see that effect in the graph above: the steep increase in bond returns starting in about 1980. Today interest rates can’t fall like that and prices can’t rise like that in the future. The chance that bonds outperform stocks over a 10-year Holding Period in the future is a lot less than 20%. (Also see NEC, End Notes Part 2.)


== Short Holding Periods and Mix ==


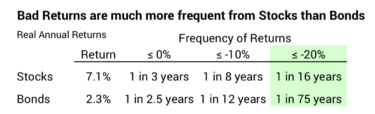
The mix for a 0 to 3 year Holding Period is a bit more complex. Stocks are much more variable than bonds for one-year return periods. for example, a bad 1-in-10- year event for stocks is -16% or worse real return. When stocks have a negative return like that, bond returns have been much better. Rob wants that money for the car to be there in three years, so he would tend to conclude, “Easy: I want 100% cash and bonds for that.”


That’s a good choice, but not exactly the best choice. A good thing happens when you mix a little bit of stocks in with the cash and bonds: you get less variation in return and you get greater expected return. You get less variation because the peaks and troughs of the real returns for the two don’t align. Enough of the upswings of stocks cancel enough of the downswings of bonds and vice versa to result in a smoother, more predictable total ride. And it’s a better ride because that bit of stocks increases the expected return to more than you would get from bonds only. More predictable return and better return. You have to like that. The math guys work the details on how peaks and troughs offset and tell us a really good mix for this Holding Period works out to be 80% bonds and 20% stocks. I buy that.


== In between ==


If a Holding Period of 0 to 3 years is 80% bond and 20% stock and a holding period of ten years and longer is 100% stock, what comes in between?


You basically want a transition that goes from 80% bond to 0% bond from years four to ten. Sketch that out on a graph, and it averages out to 60% stock and 40% bond over that period. The math guys also say that 60% stock and 40% bond mix is good for this band of Holding Period.


== My matrix and look =


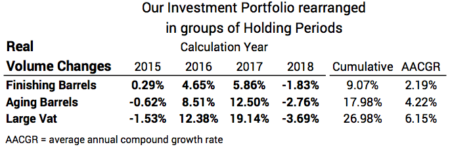
Each December 15 I recast my portfolio into these three Holding Periods with those mixes. (I keep spending for the upcoming year in cash.)


I know my stock and bond returns by the way I’ve organized our accounts. For a mix of 80% bond and 20% stocks I should see lower returns over time but less variation in return. For my Holding Periods that are 100% stocks I should see greater returns over time but much more variation. And the in between should be, well, in between. That’s what has happened over the four years I’ve been doing this.


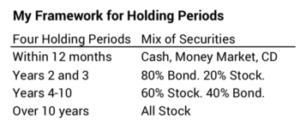
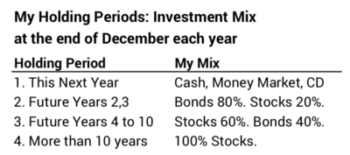
Conclusion: When your are building your nest egg, think about Holding Periods: how long you will hold onto an investment before you sell it for spending. Estimate your spending needs into Holding Periods. Each period should have a proper mix of stocks and bonds. I like this as Holding Periods: A) upcoming year (basically all cash), B) following years 2 and 3, C) years 4-10, and D) over 10. When you do this, you will get to a proper total mix of stocks and bonds.


* See Chapter 6, Stocks for the Long Run. Jeremy Siegel. This is an excellent discussion of “Risk, Returns, and Portfolio Allocation”.


What would be your advice to someone building their nest egg?

My nephew Rob, age 25, asked me for some of my thoughts on investing. I gave him a few quick thoughts but then decided to describe what I think I’ve learned over the decades. This post is my advice to someone age 25. I would hope that Rob could be a self-reliant, highly efficient, and very successful investor. It’s not hard to do. Really! As I think about it, this advice is really for someone at any age who is building their nest egg. They’re in the save and invest phase. Not my spend and invest phase. Would this track with your thoughts?


== Imagine 8X. Even 16X. Save and Invest. ==


Why save and invest? Because when you store your savings in stocks you will build multiples more spending power in the future. Imagine: “What can I do with $1,000 now?” and ask, “Would I be happier if I had 8 times – maybe 16 times – this amount of spending power in the future?” This is a real choice because of the earning power of stocks and the power of compounding of returns.


== Think Real: avoid the distortion from inflation ==


We want to understand what happens to our money in real spending power. We make better financial choices when we think in terms of real return rates and real growth in future spending power.


Inflation shrinks the spending power of our money. The number of dollars we have today has less spending power than the same number of dollars we had in prior years. Inflation can lead us to conclude we are doing better than we really are. Inflation has a way to make the difference in return rates from stocks and bonds look less important than it really is.


== Store and build wealth in stocks ==


I can’t think of any investment that has a greater long-run return rate than stocks. Stocks average more than 7% real annual return. The next best, bonds, have averaged 3.1%. Your home – real estate – won’t increase in value much faster than inflation; after all, real estate is a component of the calculation for inflation. The value of homes Patti and I have owned increased by no more than 1% in real value per year when I adjust for inflation and all that we invested to improve them. Money market and bank savings accounts earn about 1% real return. Cash earns less than 0% because of inflation.


Stocks therefore are powerful earners and have 2.3X the real, long-term return rate of the next best alternative.


== Compound growth expands returns ==


Compound growth means you earn money on your original investment and on all the accumulated amounts in prior years. Small differences in annual return rates compound to big dollar differences in growth. The growth of stocks in one year is 2.3X that of bonds, but over time that difference expands to more than 6X.


You can understand this by applying the Rule of 72. That Rule gives you a good estimate as to the number of years it takes for an investment to double. You divide the investment return rate into 72: an investment at 8% will double in 9 years. At a shade over 7% real return, an investment in stocks will double in spending power in 10 years. (That’s close enough.) At 3.1% real return, an investment in bonds – the next best alternative – will double in 23 years.


You have many years to let compound growth work its magic. Let’s assume 40. (Your life expectancy approaches 60!) For stocks that’s four doublings or 16X. Over that same period bonds will muster about 1.7 doublings and grow to about 3.4X. When you just look at the growth portion of the two, the difference is more dramatic.


== Tax-Fee Growth! You Can’t Beat It! ==


Tax-free growth is a wonderful thing. Always contribute to your retirement plan at work to get your employer’s match; that’s free money to you. Contribute more if you can to that retirement plan and to a Roth or Traditional IRA: $6,000 per year now. If you ever have a High Deductible Health Plan, contribute to a Health Savings Account: it’s the best ever.


== Investing Costs Cut. VERY DEEPLY. ==


It’s this simple: do you want your investments to grow at a rate of, say, 7.0% or 5.7%? In this example below, would you rather have $56,000 more in spending power or not? Tough choice, eh? Most investors surprisingly choose the high cost option and earn at 5.7% giving up that $56,000. Huh? They don’t readily see and understand their investing costs (The financial industry doesn’t make it super clear.), and they don’t correctly think through the effect of high costs over ten, twenty, thirty or forty years.


We all incur investing costs. These costs are a net reduction from market returns. Investing costs are the sum of a fund’s Expense Ratio plus any fees you pay to a financial advisor. Ideally you are self-reliant and don’t incur advisor fees. Investors who incur fees from Actively Managed Funds pay roughly 1.4% of the value of their portfolio per year. That’s the direct reduction in their annual returns: 7.1% before costs less 1.4% = 5.7% net to you). Self-reliant investors no more than .10% (7.1% less .1% = 7.0% net to you). You will be hurt in the future – not do as well as you could have – if you fail to be an efficient, self-reliant investor. The good news is that it’s easy to be efficient and self-reliant.


== You can be in top 6% of all investors ==


You’ll be a winner when you predictably keep more of market returns. You keep more when you pay financial folks less. When you pay less you will be in the very top ranks of investors. The secret: only invest in broad-based, rock-bottom cost Index Funds. That’s easy to do today.


I own four Index Funds or ETFs equivalent to funds that in turn own a total of 24,400 securities – the great part of all the securities traded in the world. My total weighted investing cost is less than 5% of 1% of my total portfolio – .05%, and my costs have declined twice in the last year even though I didn’t change a thing in my portfolio.


Your chances to win are slim to none when you try to beat the market. That’s what Actively Managed funds try to do and basically why people hire financial advisors: they think those smart, hardworking folks can steer them to the funds that will earn more than market returns. It’s mathematically impossible for Actively Managed funds in aggregate to outperform Index Funds. Some funds do beat their peer index in a year, but over 10 years, it’s only about 6% who do, and it’s impossible to predict the future winners. You have more than a 40-year time horizon; that means it will be fewer than 6% who will outperform. You know you will be in the top 6% of all investors when you stick with index funds – and you’ll likely rank much higher than that.


I think the human brain is wired to tell us we can beat the market. We tell ourselves we are really smart, above average, and competitive. Investing in Index Funds means we are accepting that we will take a tiny bit less than what the market gives all investors and never beat the market. That just doesn’t fit who we are. I had to shift my thinking from “beating the market” to being a “champion investor” – focusing on how I likely will rank compared to other investors. Top 6% is good enough for me! That wasn’t an easy transition. It took me several years to get over my bad habit of investing in Actively Managed funds or taking flyers on stocks friends of mine would recommend. (Almost all those flyers were disasters.)


== You win by staying the course ==


Stocks and bonds have their ups and downs. Over your lifetime it is 99% certain that you will experience a year with -17% or worse return of stocks. Do not falter and change course. I invested $2,000 in a stock Index Fund in my IRA in 1982. It declined by 20% in one day (!) in 1987. It declined by -42% real return over three years starting in 2000. It declined by -36% return in 2008. When I sold that specific investment in January 2018 (in effect) it had grown 19.7X of that original spending power; that’s more than I’d calculate from the Rule of 72 (36 years would be 3.6 doublings and close to 12X) because the real return rate over that period was greater than 7% per year. (With inflation thrown in, my $2,000 turned into $102,800.)


== You just need to own four funds ==


You need no more than four Index Funds and you will own pieces of almost all the stocks and bonds in the world. That’s really all you need to do to be self-reliant and efficient. You saw the ones I own above. You can find these and similar funds or ETFs at Fidelity,Vanguard, Blackrock, or State Street.


== Use Holding Periods to set your mix ==


A Holding Period is the number of years you hold an investment before you sell it for cash to spend. Money you put in your IRA this year will likely sit there for 40 years before you sell securities for your spending. That’s a 40-year holding period. Stocks always outperform bonds by a wide margin for that length of time. That tells you what you should invest in: only stocks for that many years.


You will have other needs for spending with much shorter holding periods. You may have a need to save and invest to spend on a car four years from now. Or you want to save for a downpayment for a house. Those will clearly have short holding periods relative to your retirement accounts. In these cases you want to hold a mix of stocks and bonds. Bonds are insurance against the chance that stocks nosedive. When stocks have cratered – the ten worst years since 1926 average -27% real return – bonds don’t. You’ll be happier having held a bonds for short Holding Periods. You can see here that I annually take a snapshot of our portfolio arranged by Holding Period. Short holding period: mostly cash, money market, CDs or bonds. Long Holding Period: all stocks.


== Keep it Simple ==


Over time you want to keep your money in one place so you can keep it really simple as to what you own and how you are invested. Your accounts and holdings can get spread out and hard to follow with retirement plans from different employers and different kinds of IRAs. I have all my money at Fidelity. I like Fidelity’s web site and service. You cannot beat Fidelity’s cost for Index Funds.


Conclusion: You can be a winner in the top ranks of all investors. The first key is to Save and Invest as much as you can. You’ll most likely have 8X to 16X more in spending power from your investment in stocks in your retirement accounts, for example. The second key is to be Super-Efficient (and effective) by only investing in Index Funds: you only need to hold four. The third key is to Stay the Course: the value of your portfolio will vary; you’ll see periods of big downswings. But keep in mind that you have many years before you will need to sell any of it for your spending. You reduce uncertainty of the amount that will be there when you want to sell securities for your spending by estimating your spending needs by Holding Periods – how long you’ll hold on to an investment before you sell it. For short Holding Periods you’ll want mostly cash, CDs or bonds. Long Holding Periods should be all stocks.


What would you do if your Safe Spending Amount increased by 50%?

How would your life change if your annual Safe Spending Amount (SSA) – your annual pay from your nest egg – increased in real spending power by 50% in the future?  How would you live your life differently? Buckle up. You have to think about this, because this is what most likely will happen to your SSA: in a decade you’ll most likely be paying yourself roughly 50% more from your nest egg than at the start of your plan. Over your lifetime: double. This post explains why you will see an increase like this if future returns for stocks and bonds match their historical real returns.


== SSA is SSR% * Investment Portfolio ==


Let’s go back to the basics. Your SSA is the constant dollar amount – constant spending-power amount – that you can spend each year and confidently know you will not deplete your financial next egg. Your initial SSA is the multiplication of your Safe Spending Rate (SSR%) and your Investment Portfolio. (You subtract an off-the-top Reserve from your total portfolio to get to your Investment Portfolio for the calculations.) Your SSR% is always low because it is based on zero chance of depleting your portfolio in the face of the Most Horrible sequence of financial returns we might face. Your SSR% is a function of how many years you want for zero chance of depleting your portfolio. More years = Lower SSR%. Fewer Years = Higher SSR%. See Graph 2-7, Nest Egg Care (NEC).


== Two factors are at work ==


• Factor #1. As we age, we should accept fewer years for zero chance of depleting, and therefore a higher SSR% makes sense. Patti and I started out almost five years ago and set 19 years for zero chance of depleting our portfolio. If we stick to the same logic that got us to 19 years, we need 16 years now. In five years it will be 12 years. See Chapters 2 and 3 and Appendix G NEC.


• Factor #2. Your SSA will increase at expected returns because your expected return rate exceeds your SSR% for many years. Rather than finding the median sequence of returns with its variation in annual returns to show what happens, I simply use steady real expected returns – 7.1% for stocks and 2.3% for bonds. You can see the expected real return on Patti’s and my Investment Portfolio is 6.38% per year for our 85-15 mix.


These two factors are analogous to the factors that will result in doubling of your RMD at expected returns for stocks and bonds.


== How much will SSA increase? ==


Punchline with details to follow: it most likely will at least double in your lifetime.


I display in this table what happens for five years at that steady 6.38% real return rate for our portfolio. I use a 4.40% SSR% – the rate Patti and I started with at the start of our plan. The table assumes a starting Investment Portfolio of $1 million. Over the five years SSA increases in real spending power by about 14%. (We’re not close to double, but just wait.) Portfolio value increases each year.


Let’s walk through two years to see how this works. Also see discussion in Chapter 9, NEC.


• Spending Year #1: 2015. In late December 2014, we withdraw $44,000 (4.40%) for spending for the upcoming year. We start January 1, 2015 with $956,000 in our Investment Portfolio.


We spend or gift all the $44,000 that we withdrew for spending. We did not save one dime. We threw nothing back into the pot. We earn the expected 6.38% that year on the $956,000 and incur the assumed Investing Cost. We have $1,015,200 at the end of the year right before our next withdrawal. That’s obviously more than the $1,000,000 we started with. That means we have more than enough to support our current SSA. We can step up to the SSR% appropriate to the fact that we are one year older: 4.50%. We withdraw 4.50% of $1,015,200: $45,700 SSA. That leaves $969,500 for the start of the next year.


• Spending Year #2: 2016. We start January 1, 2016 with $969,500. We again spend or gift all the $45,700 that we withdrew. We again earn 6.38%. We have $1,029,500 right before the next withdrawal. That again is more than we had right before the last withdrawal. We again have more than enough for our current SSA and can step up to the 4.60% SSR% due to the fact we’re another year older. We withdraw 4.60% of $1,029,500: $47,400 SSA. That leaves $982,100 for the start of the next year.


This pattern repeats. SSA increases every year or every other year. Portfolio Value only stops growing when our SSR% bumps into our 6.38% expected return. That happens for us in December 2024, Patti’s age 77 and my age 80. That does not mean our SSA declines thereafter, though.


== SSA continues to increase ==


I continued the table for a total of 20 years, and I plot SSA. The graph tells me in 15 years from now – 20 years from the start of our plan – our SSA will be double the spending power we started with in 2015: start of $44,000 for spending – or gifting – in 2015 and +$88,000 spending in 2034. There’s our doubling! Both are measured in the same spending power.


== Patti and I are ahead of expected ==


I add the plot what has really happened to our SSA given the actual ups and downs in returns so far. (You can see the details of this calculation here and here.) Patti and I are ahead of our expected SSA because of the high returns in 2016 and 2017. (You also would be ahead of your expected SSA had you started your plan before 2017.) I conclude that we may have to wait a few years before the next increase.


== Another $14,500 in just five years ==


Our SSA is $8,800 per year – times our multiplier of the assumed $1 million initial value – more than our starting amount. We could expect $14,500 more per year in five years. And another $14,000 in another five years. What a problem to have!


== What’s this mean for us? ==


Knowing that significant increases in our SSA are very likely gives me more confidence in our current SSA. We do this anyway, but Patti and I are more comfortable in fully spending (or gifting) it TOTALLY in the year.


Patti and I were very happy at $44,000 and now we pay ourselves $8,800 more in that same spending power. How will another $14,500 per year change our lives? And another $14,000 after that?


What more can we spend to Enjoy More Now? Travel is our biggest discretionary expense. We certainly are not holding back on the amount we travel, and we don’t hold back on expenses when we travel. I’d spend more on home maintenance so the house and yard looks great all the time, but that really isn’t a lot more. I honestly don’t think we can spend very much of that extra on ourselves. Much of the increases has to go to Giving to those we care about. We really like that idea. That will make us happier.


Conclusion. If you’re like Patti and me, you gear your spending to be ultra-conservative. Nest Egg Care gets us to our Safe Spending Amount assuming we face the Most Horrible sequence of financial returns. We almost certainly won’t ride a sequence like that. We need to think through what happens to our SSA when we don’t face Most Horrible. If future stock and bond returns match history, our SSA – your SSA – will increase by 50% in a decade and by 100% over our lifetimes. Patti and I are already ahead of that pace. We need to think through what that means for us: how do we think about our spending now? How will we spend – or gift – differently as our SSA increases?

Are chances increasing for a Big and Painful market correction?

Blog reader Bill is starting out on his plan. He’s figured out what he can pay himself from his financial nest egg and asks, “We now have a long string of years without a major market decline. Are we ripe for one? Should I start out spending less than my calculated SSA?” Good question! I wrestled with that question four – almost five – years ago when I started my plan. And that thought crosses my mind in early December when I Recalculate for next year’s Safe Spending Amount (SSA). (See Nest Egg Care (NEC), Chapter 9.) This post expands on my basic answer: I don’t think we are close to conditions that would lead to a huge market decline that sinks your portfolio. But if it makes you feel better and safer, increase your Reserve (See Chapter 7, NEC); that has the same effect as lowering your SSA – your paychecks from your nest egg.


Here are some basic reminders.


== Your plan always assumes the worst ==


The key planning assumption for NEC is that we retirees will face the MOST HORRIBLE of financial returns in history essentially starting TOMORROW. This most horrible sequence of returns will have a devastating effect on our portfolio, but we can take actions that assure zero chance of depleting our portfolio for many, many years.


The key action we take is to have a low Safe Spending Rate (SSR%) and that results in a low Safe Spending Amount (SSA). (Maybe we could debate: is being a low cost investor more important than this action or just a prerequisite?) I found the SSR% for Patti and me at the start of our plan – for 19 years with zero chance for depletion of our portfolio – was 4.40%. (See Chapter 2, NEC.) That equates to LESS THAN 0% real annual return over 19 years. If we had assumed 0%, our spending rate would be 1/19 or 5.25%.


The fact that our SSR% is based on less than zero cumulative return reflects the ugly annual declines in returns within the long sequences of 0% cumulative return for stocks (18 years) and for bonds (48 years!).


== The worst is REALLY BAD. And rare. ==


The worst sequences of returns that sinks your portfolio – basically for any mix of stocks and bonds – includes a few years of SHARP, NEGATIVE stock returns that eat up roughly 45% of the spending power of your stock portfolio. This damaging decline from stocks has to hit you in within the first five or six years of your retirement to have its most devastating effect. That’s when a large percentage decline eats the most dollars relative to your starting portfolio value. When you combine the effect of withdrawing for spending, it gets really hard to replace those dollar losses even when returns improve. Bonds have not been golden: they’ve cratered and eaten 41% of spending power over a five-year period.


We’ve had VERY UGLY real declines for stocks three times in the 92 years since 1926 – that equates to a 1-in-30 year event. (It’s a 1-in-50 year event had I considered the return data from 1871.) Those steep declines don’t have to hit us right at that start of our retirement to really hurt us, meaning the chance that we’ll suffer a major decline in our portfolio within a few years from the start of our formal retirement plan is greater than 1-in-30. It’s still fairly rare. You can see more scary periods of historical returns for stocks here and read about the worst sequence that drives our spending rate to a low level here. That sequence has the two-year -49% real decline from stocks and the five-year -41% real decline from bonds! Wow.


== Your Reserve buys a layer of Safety ==


Nest Egg Care adds a layer of safety to your plan by asking you to take 5% off the top of your total portfolio – roughly one year of spending. (See Chapter 7, NEC.) In effect, you stick that Reserve under a mattress and try not to think it even exists. You base your calculation for your Safe Spending Amount (SSA) on the net, which I call your Investment Portfolio. The 5% Reserve lowers the dollar value you’re using to get to your SSA and that lowers your SSA by 5%.


Hopefully you will never have the need to tap your Reserve, but you will use it for your spending when we hit an annual return or several years of return that are really scary. We are not selling securities – especially stocks – from our Investment Portfolio. We’re giving ourselves a shot for stocks to rebound, side-stepping severe damage to our portfolio.


==== Do I think MOST HORRIBLE is near? ====


No, I don’t.


• Statistically a bad 1-in-10 year event is a real decline of -17% or greater. We’ve not had a year like that for more than ten years. But that does not mean the chance of a really bad year is increasing. Our last year like that was 2008, and it was much worse than -17%; 2002 was another year; we have to stretch back 27 years to 1974 to find the next prior year.


• I think it’s the economy that will drive the next steep decline: recession, depression, or out of control inflation. We combined several recessions and very high inflation averaging over 7% per year for the 15 years starting in 1969 – that’s the start of the Most Horrible sequence of return that we use to set our SSR%. I don’t see any conditions that suggest we are close to those conditions. Do you?


• The other concern is an over-heated market or over-priced stocks. All three of the years that kicked off declines (1930, 1969, 2000) came after a period of very high stock returns. You can see those run-ups as deviations well above the long-term trend line in the graph below. They even look like bubbles. When I look at the pattern of stock returns now, I don’t see a deviation – a bubble above the long-term trend line.


== We make decisions based on emotion ==


We make decisions by emotion and not by logic. We’re human! I can completely understand that if Nest Egg Care tells me a spending rate is safe then by gosh I’m going to do something to make it even safer. It’s just too important. I can do two things that are logical for greater safety:


#1) Lower my spending rate. Bill’s absolutely right. That’s the number one lever to increase safety by far. Lower spending BY JUST A LITTLE means a longer shaft length of your hockey stick – the years with zero chance of depleting your portfolio. (See Chapter 2, NEC.)


That’s essentially what Patti and I did at the start of our plan. (See NEC, The Patti and Tom File at the end of Part 2.) Patti wanted two – no three – years of spending in Reserve. We negotiated: I put two years into Reserve. That lowered our SSA by another 5%. That is what I would recommend to you: increase your Reserve. That means you are lowering your SSA. I like this approach better than just spending less than your calculated SSA. You don’t want to get into the habit of “Saving” part of your calculated SSA. That simply means you aren’t enjoying (and giving) as much as you should.


#2) Lower my Investing Cost to less than that assumed in Nest Egg Care (NEC) – .18%. Lower cost is always a good move, but lowering to less than .18% is a small lever: it does not come close to #1 in lengthening the shaft of your hockey stick. Our Investing Cost is less than one-fourth that assumed in NEC. That took no work: fund companies have continually lowered their Expense Ratio for the funds Patti and I own.


Those two ARE the options. It is not logical in my mind to have a low mix of stocks. Or to throw other kinds of investments than stocks and bonds into your mix; those actions aren’t buying you added safety that you otherwise would get from #1 and #2. Anything less than 75% stocks makes NO SENSE to me. Nothing about less than 75% stocks is “more conservative” in my mind. See Chapter 8, NEC.


 == Drop that extra Reserve? ==


Over time Bill will Recalculate (Part 3, NEC), hopefully, to a greater real SSA. Then he can rethink the need for that extra Reserve. Patti and I started at SSA of $44,000 per $1 million of Investment Portfolio. Now our SSA is 20% greater in real spending power. I have not lowered that original two-year Reserve, though. Doing that would immediately boost our SSA by 5% because it would immediately increase our Investment Portfolio. But I have no big urge to do that. No urge to explain why I want to lower the Reserve to Patti. Maybe I’ll do that the next time I Recalculate to the next real increase in SSA. Maybe not.


Conclusion. We all worry that we aren’t being conservative enough for our financial retirement plan. I assert that the Safe Spending Amount (SSA) that you get from Nest Egg Care is darn conservative. But it’s human nature to be more conservative than what someone else recommends. If you want to be more conservative, increase your off-the-top Reserve – the amount that is not part of the math to get to your SSA. In effect you are lowering your SSA. That has the effect of adding years of zero chance of depleting your portfolio.

How much do higher fees eat from expected growth of your portfolio?

Neighbors Bill and Mary, nice folks age 50, told me that they just signed on with a financial advisor. He’s going to manage $800,000 for them. He said his fee is 1%, so they conclude they are spending $8,000 per year for his advice and help. His help may be valuable to them, but I calculate that over 15 years Bill and Mary give up to nearly 30% of the expected growth of their portfolio – a total cost of nearly $450,000. By the 15th year, they are giving up the value of a Mercedes Benz SUV per year. That’s clearly not what I think they have in mind from “1%”. The purpose of this post is to explain the discrepancy between 1% and 30% and that $450,000 and the Mercedes SUV per year.


In fairness to the advisor, Bill and Mary are not confident in making financial decisions. They don’t have much knowledge about investing. It sounds complex to them. They don’t have a will, and the advisor said he would help them get that task completed. They want to decide on disability insurance. He’ll help with that.


== Total Investing Costs ==


The advisor did not mention the internal fund costs they would incur for their portfolio, the weighted Expense Ratio for all the mutual funds, ETFs and securities he would select for them. I’ll guesstimate this at .6% of the value of their portfolio, which is below the average for actively managed funds.


We have to conclude that Bill and Mary’s resulting Investing Cost of 1.6% per year with their advisor is, in essence, a direct reduction of the annual return rate that they get to keep. That’s their Investing Cost. We can not assume the actively managed funds their advisor picks will outperform the market before deduction of those fund costs and result in a lower net cost than 1.6%. The chance of a mix of actively managed funds doing that is just too darn low. That’s clear from many, many studies and the thorough one described here.


== Compare two options over 15 years ==


We need to clearly think through the two options. It isn’t a one-year comparison of cost. I’m measuring their cost as the difference in the amount they would have in a future year, not simply the annual differences in fees that they pay. This is the right way to look at it, don’t you think?


Here we go: I pick 15 years as the time period we want to look at. I assume $800,000 now and that Bill and Mary contribute $15,000 in today’s spending power to their investment account each year. Here are two options.


Option #1. Spend $10,000 now on a consultant to help them construct the will, pay the legal fees for the will, and a hire a consultant to help them sort and recommend disability insurance. ($10,000 sounds like too much to me for these tasks, but let’s go with it.) Invest the $790,000 balance themselves at low Investing Cost. Let’s use 6% of 1% or .06% as the Investing Cost for a simple portfolio in this case of just two funds that own all the stocks in the world. As reference, my Investing Cost is a shade over 4% of 1% or .04%.


Option #2. Invest the $800,000 with the advisor. I’ll assume he actually pays the legal fees for their will, but that would not be usual from my experience. Investing Cost is 1.6% per year.


I compare the growth of their portfolio for the two options. The difference between the two is their cost. I use Excel’s Future Value Calculation, but you can also see the same result in more detail on this spreadsheet.


Wow! Bill and Mary start with $800,000 and the difference in the two options in 15 years is nearly $450,000. That sounds almost mathematically impossible, but it isn’t. Option #2 costs them $450,000 more than Option #1!


The average cost works out to be about $30,000 per year ($448,000/15 years). In the early years, the cost penalty for Option #2 is about $12,000 per year, but that grows every year eventually to about $58,000 in the 15th year. The percentage penalty in annual growth from Option #2 also increases. Both dollar penalty and percentage penalty will increase each year thereafter. On average Bill and Mary bought the equivalent of a $30,000 new car each year for their financial help: their advisor, his firm, and fund managers. In later years, they are buying them a luxury SUV every year.


== Results with different Expected Returns ==


In the example above, I used a 100% stock portfolio for Bill and Mary. I assume that 15 years is their holding period: they won’t sell any of that before they glide into their formal retirement plan somewhat after 15 years. That may be too ambitious for them. I can run this same analysis using a lower mix of stocks and greater mix of bonds.


A mix of more bonds (less stocks) results in lower portfolio expected annual returns and less of a dollar difference between the two options. But this surprised me: the percentage penalty of Option #2 increases as the mix of Bonds increases. Option #2 is relatively worse for them with a greater mix of bonds. The penalty of Option #2 is 25% at a mix of 0% bonds (100% stocks). The penalty of Option #2 is nearly 30% at a mix of 35% bonds (65% stocks). That’s primarily because the advisor fee of 1% cuts much deeper – a much greater percentage reduction – into the expected return for bonds: if you have more bonds you’ll suffer a deeper cut of your total expected portfolio return.


== Will they ever know? ==


When Bill and Mary go down the path of Option #2, will they ever reach a point of understanding that their returns could be so much more? I doubt it. In our initial example of an all stock portfolio, at expected returns they would see their $800,000 portfolio and their annual additions grow to $2.1 million in 15 years. They’d feel very good about that. Will the financial reports from their advisor clearly show that their returns lag market returns or a benchmark return for their mix of stocks and bonds? They’ll never see that comparison. They’d have to do the work to understand. They’d have to do the calculations or by run a side by side experiment using low cost index funds with a portion of their portfolio.


Conclusion. Investing costs are in essence a direct reduction of your net returns in your portfolio. My Investing Costs are a low .04%. That means I get to keep about 99.4% of the expected real return on my portfolio of 85% stocks and 15% bonds (6.34%/6.38%). If I incurred investing cost of 1.6% I’d get to keep about 75% (4.78%/6.38%). When you measure the growth in portfolio value for different net returns that you keep, the difference between high cost and low cost is ENORMOUS: in 15 years an initial $800,000 portfolio invested with high Investing Cost could be $450,000 less than the same portfolio invested with low Investing Cost.

Is Rental Property a good income generator for you?

I read this article that suggests Rental Real Estate is a good investment for retirees. I hate even thinking about investing in rental real estate. Or why I’d hold onto it if I had it at this stage in life. This post discusses why I think owning rental property is a really bad idea for us nest eggers.


== Why I don’t like rental Real Estate ==


Oh, let me count the ways!


1. Rental Real Estate is a non-financial asset that can’t consistently give you cash for FUN. Yes, there is modest income that you can spend. But you have most of your money locked up so that you can’t spend to ENJOY. You can’t gift enough to your children’s retirement accounts. You can’t gift enough to your grandchildren’s 529 education plans. Only financial assets consistently give you cash and the potential for more cash for FUN, FAMILY or COMMUNITY while you are alive. I view these non-financial assets largely as a dead weight hanging around your neck.


You want some non-financial assets, though, as a deep, deep reserve to your financial retirement plan, which is fueled by your financial assets. [See Chapter 1, Nest Egg Care (NEC).] My guess is that you already have enough non-financial assets – primarily the equity in your home. You don’t need more.


Most folks I know have TOO MUCH non-financial assets and no HELOC (Home Equity Line of Credit). Because they are overloaded with non-financial assets – or underloaded with financial assets – they are limiting what they can spend on Fun, Family, and Community. Because they have no HELOC, these folks are spending their FUN MONEY on NOT-FUN when the non-financial assets need cash to keep them up to snuff.


2. Rental real estate can’t get close to the potential for increases for your spending. At other than Most Horrible sequences of financial returns, your Safe Spending Amount (SSA) will increase in real terms. (See Part 3, NEC.) Over the first four years of our plan (Patti and me), our SSA has increased by 20%. All nest eggers saw an increase in their SSA over those four years. And the average return rates over the four years were not outta the ballpark by any means. Rental real estate isn’t going to come close to paying you 20% more in four years – that would only come from increasing rents by a real 20% over four years. Your renters would revolt at an increase like that.


3. Rental real estate is painful work. Oh, the headache and hassle: the uncertainty of how long tenants stay; the cash outflow when you aren’t collecting rent; the costs to ready the property for new tenants; the marketing costs to find new tenants; the general and surprise repairs and maintenance; the record keeping. Really, why would anyone ever buy into that? It’s the exact opposite of FUN to me, and this is the time of life to really focus on what’s FUN.


4. You’re hurting your heirs as well as yourself. If you have rental property, sell it and put the proceeds into your financial nest egg.


I am surprised at folks who say, “I’ll hang on to this property because my heirs will get a step up in value when I die; they avoid capital gains taxes that I would otherwise pay.” These folks have the cart before the horse.


My friend, Roy, tells me that he and his wife own a 1,000 square foot house with a lake view. That size might more properly be described as a cabin. His sole, single renter has been there for years and causes no problems; he even paid for the new refrigerator when the old one went kaput. Renting to him has been headache free. Roy hasn’t raised rent much over the years because the tenant has been so good, but Roy has close to no net cash rental income now.


Roy thinks he can net $150,000 from a sale. But he tells me his problem is that his depreciated cost basis is $20,000. His tax preparer told him, “DO NOT SELL!” – or to sell it and reinvest the proceeds in rental real estate again – to avoid paying capital gains taxes in his lifetime. At the death of Roy and his wife, their children get the step up in value. They could sell then and not incur the capital gains taxes that Roy would incur if he sold. Roy and his wife HATE the idea of paying nearly $20,000 in added taxes now, and they conclude their tax preparer is giving them solid advice. Smart guy, I’m sure.


Does that recommendation make sense? NO! This is an example of failing to thoroughly engage the computational part of our brain to compare the two opportunities.


Roy has two options: #1 Not Sell. Hold on to the property or sell it and put the proceeds in similar rental property. His heirs never pay capital gains taxes. #2. Sell. Pay gains tax and put the net proceeds into his financial nest egg. I use expected real returns for his real estate (1% per year) and for his mix of stocks and bond (5% per year after taxes each year). (See here for expected real return rates for stocks and bonds.)


Option #2 wins handily. If he sells, pays tax and invests the proceeds in his mix of stocks and bonds it would take just four years to have more money than his heirs will ever get from the real estate. Roy or his heirs would have nearly $47,000 more money in a decade. (If I had used 2% real growth in value for real estate – highly unlikely in my view – Option #2 pulls ahead in five years, not four.)


This comparison gets ridiculous if I run this out 20 years. Roy’s heirs have than $160,000 more in spending power in 20 years.


== Sell and NO future taxes ==


I personally like this course of action: Sell and Invest the proceeds in 529 plans for the grandchildren. That means NO future capital gains taxes. The grandchildren are very young. The total can compound from a greater mix of stocks than Roy and his wife might want in their retirement portfolio. I calculate this adjustment – the effect of avoiding future taxes on gains – means Option #2 results in $65,000 more in a decade (not $47,000), and that grows to $230,000 more in today’s spending power in 20 years.


Conclusion. Some folks recommend rental real estate as a solid investment for retirees. It’s tough to come up with something that’s worse in my opinion. Non-financial assets can’t come close to your financial assets in providing cash for you to spend to enjoy. They can’t touch the growth potential of financial assets at expected return rates. I suggest you sell rental real estate, pay the gains taxes, and put the net proceeds in your nest egg. My guess is you already have enough non-financial assets – your home. You don’t need more. It’s time for FUN.

Do we need to change our spending habits when we are retired?

Patti and I have slowly changed our spending habits, but the change was not in the way that you might think. We slowly changed to be more tolerant of spending that gives one or both of us pleasure. We no longer are bugged by the relatively small amounts the other spends on things they enjoy. That’s primarily stemmed from the process of truly trusting our annual Safe Spending Amount (SSA). [See Chapters 2 and 12, Nest Egg Care (NEC).] It also helps, obviously, that our paychecks – the monthly deposits into our checking account that add to our total SSA –are 20% more in real spending power now than they were in 2015. This post explains the evolution of our attitudes about spending money.


== $20. Decades ago. ==


Patti’s spending habits could be described as frugal. She could treat nickels as if they were manhole covers. This spending habit comes from her Mom, in particular, and was passed on in spades to her three daughters. Two sons missed out on this gene.


Years ago Patti’s habit was to ask if she could spend $20. We both remember the location and instance of this conversation. Patti, “I like this sweater. It is on sale for $20. (You can tell that was decades ago.) Is it okay if I buy it?” Tom, “Yes, but please don’t ask me for permission to spend $20. You can spend $20 all you want. $20 purchases will not have a meaningful effect on our finances now or in the future.”


That was a turning point for Patti. I think it was important, though, that I kept reminding her, “We’re just fine financially. Don’t sweat the small stuff.”


== About five years ago ==


Once I was retired, however, I became annoyed at Patti’s purchases. The $20 amount climbed to perhaps $60. That’s probably not far off from $20 adjusted for inflation, but the number of purchases and packages arriving on our doorstep started to bug me. It’s a lot easier now for Patti to spend $60. She can buy with a few clicks on the computer.


My annoyance also had something to do with not being totally certain as to what was safe to spend. I knew we had been good savers and investors for decades, and I always thought we had enough for retirement. But I never was sure that this was true or how to translate what we had to an amount that was safe to spend so we’d never run out. I was not comfortable in saying, “We’re fine financially. Don’t sweat the small stuff.”


== The shoes. The room at the Awahnee. ==


Two annoyances bubbled up to the surface. One for me and one for her at about the same time. I was annoyed at another pair of shoes purchased on sale from Little’s in Squirrel Hill or the FedEx delivery to our front door from Cole Hahn. I would nip at her, “Not ANOTHER pair of shoes! You don’t NEED another pair of shoes. When will this stop?”


Patti also was annoyed with me. We were planning a visit to Yosemite. I found three options in the valley. For the dates we wanted, one was not available. One that was available was $280 per night and the spectacular Ahwanee Lodge was $500 per night. Of course, I went for the Ahwanee for $220 more per night. I booked it and charged one night as a deposit to our credit card. Oh, did that raise eyebrows when she saw that on next month’s statement! “This is for just ONE NIGHT at Yosemite?”


== Now that we know ==


We got over those bumps after I calculated our Safe Spending Rate (SSR%). (See Part 1 Nest Egg Care.) Our SSR% was more than the general Rules of Thumb I had in my head. And I didn’t trust the general Rules: they provided no details as to how their Rules  were calculated. I trust our SSR% because I know the details, and I hope from Chapters 2, 3 and 4 you will trust yours.


We first started paying ourselves our Safe Spending Amount (SSA) in 2015 directly to our checking account each month. Paying ourselves is a big psychological edge. I do not decide that we NEED to withdraw more money for our checking account. The paycheck just arrives like clockwork. It’s the third monthly paycheck directly deposited into our checking account – we each get a direct deposit from Social Security. We get these three paychecks even though we don’t show up for work!


With the mobile banking app from PNC, I can see our checkbook balance at any time. We always have a large checking account balance. I like it sloppy. It’s silly to worry about $60 purchases now and then or even the infrequent $500 purchases.


By going through the process in NEC, Chapter 3, this has also sunk in: we don’t have that many years left together. It’s not pleasant to look at our probabilities of living: I can calculate that it’s 50% probable that one of us will have die in fewer than nine years (end of 2028). We’re both in excellent health, and we feel like we will beat those odds, but the odds are fact. Lesson: if it gives us a tiny bit of joy, just forget the amount spent. Don’t sweat details.


I’m very tolerant of Patti’s purchases. As I mentioned in this post, Patti gets a real shot of joy when those shoes arrive. Here was the delivery today: not shoes! “These Athleta pants just fit great. They cost $99, but they were on sale for $39.99. I had a $40 reward credit, so these didn’t cost anything. I still have a penny credit.” Tom, “Great. I like the design. You needed another pair. You’ve got a lot of work to do to catch up with Alice in the variety of exercise pants you wear.”


Patti now pitches in to spend more for a better room. We get a much better room when we travel for a lot less than the $220 for the Ahwanee. I just looked over our bills for our May trip to the Lake District in England. I made the reservations for 12 nights. Patti made them for two. All were the best room, in my opinion, that each place offered. I calculate that we averaged $42 more per night than the lowest priced room of the four places we stayed. We really like the places we stay and the rooms were terrific. That’s $42 for added joy each day on the trip: peanuts at this stage in our lives.


Lessons:


1. Assuming there are two of you, one of you has to have a clear grasp of the three key decisions that lock in the number of years you have with zero chance of depleting your portfolio. That person has to clearly understand the underpinnings of your annual Safe Spending Amount. That person has to grow to absolutely trust that amount.


2. That person needs to state your financial retirement plan in simple terms. Maybe state it often so the two of you are on board. “If we don’t spend more than $xxx per year, we just can’t run out of money. I can remind you of the details if you like. We’re doing just fine this year. Let’s not sweat the small stuff.”


3. Pay your annual SSA as monthly paychecks. That paycheck will arrive as reliably as your Social Security payments. Seeing the total each month makes your annual spending budget much clearer. You shift your thinking from “What do I need to withdraw for our spending?” to “How are we going to enjoy this money that keeps rolling in?”


4. Recognize that the sands of time are running. Depending on your age, you can’t count on that many more years, especially that many healthy years. A probability of living calculator helps you see this. If something gives you a shot of joy, go for it.


5. My guess is that the things that give you shots of joy throughout the year don’t cost that much. I particularly like staying in a better place and room when we are on vacation. (Patti has grown to like that, too.) Patti gets shots of joy from the new shoes, blouses, pants, or dresses purchased at a deep sale price. (I get pleasure from her enthusiasm when she tells me about her latest bargain.) And to be honest, she saves far more on airfares – almost a passion for her – than she spends on those things.

How much safer is a mix of 65% than a mix of 85% stocks?

A financial retirement plan with 65% stocks is inherently NO SAFER than plan with 85%. A plan with 85% stocks can have NO RISK or uncertainty in the life of your portfolio – the number of years your portfolio will pay you a Safe Spending Amount. If you then change your design choice to 65% stocks, you are adding nothing to safety. You can’t get lower than NO RISK. It’s a mistake to then lower your mix: if we ride a sequence of returns that is close to the average we would expect, that low of mix of stocks costs you and your heirs a LOT of money. The purpose of this post is to explain how a plan with 85% stocks has NO RISK and is a better plan.


== What is risk? ==


Risk is uncertain, variable results that lead to financial loss. We retirees want to make decisions for our financial retirement plan that lessen uncertainty and the chance of loss.


The wrong picture of uncertainty and loss: I argue the typical retiree and financial advisor focuses on the wrong time horizon and measure of financial loss for us retirees.


They focus on the chance of a one-year decline in the value of our portfolio. The annual expected real return for stocks (7.1%) is triple that for bonds (2.3%). [See here.] But one-year stock returns are about three times more variable in return. Very poor stock returns of ≤ -20% return occur about 1 in 16 years, while bonds returns of ≤ -20% occur in about one in 75 years. A mix lower in stocks always has less chance of portfolio decline in a year and therefore is less risky.


The investor just has to make a judgment on his or her personal comfort level – their emotional tolerance of a possible decline in the value of their portfolio, and then they decide on a comfortable mix of stocks. That’s the sole decision to lower risk.


The right picture of uncertainty or loss. The risk point I worry is about two decades away, and it’s a different definition of loss. I’m not unconcerned about a financial return that’s below 0% for a year, but my central concern is a multi-year sequence of really HORRIBLE annual returns that – in combination with the fact that I need to withdraw from our portfolio for spending – can destroy our portfolio.


At the start of our plan, my concern could be expressed as, “I want to know what’s safe to spend such that I DON’T RUN OUT OF MONEY for many, many years.” The loss I was worried about was a decline in my portfolio to the point it not longer would support another year of spending. I wanted our portfolio to be healthy enough to support a Safe Spending Amount year after year for decades.


That view adds a second factor to the risk equation: spending rate. That makes perfect sense: you have less risk if you spend less. Duh. How can those other folks ignore spending as part of the equation for risk?


== Eliminate the uncertainty of future returns ==


Once we eliminate the uncertainty of future returns in our planning, our Safe Spending Rate (and Amount) is clear.


We eliminate the uncertainty of future financial returns by using a planning trick. We plan for the worst – we assume we will face the MOST HORRIBLE sequence of future stock and bond returns. We use a Retirement Withdrawal Calculator (RWC) that shows how a portfolio fares over time for a given spending rate.


• We set our target number of years.


• We make a choice for our mix of stocks and bonds. (All RWCs require this as an input.)


• The best RWC I find I find – FIRECalc – requires us to decide on our Investing Cost, and this turns out to be a very important decision. Investing Cost is the expense ratio for the funds and securities we own and advisor fees we pay each year. (See Chapter 6, NEC.) Those costs are generally expressed as a percentage of our total portfolio and, in essence, are subtracted from market returns each year. They’re a real drag.


• Then the RWC (basically) spits out the spending rate that gives us ZERO CHANCE OF DEPLETING for our target years using the MOST HORRIBLE sequence of returns it constructs. (See Chapter 2, NEC.) We make that rate our official Safe Spending Rate (SSR%).


With those three decisions you eliminated all uncertainty that result in fewer years that the target you set. At the start of our plan Patti and I had ZERO risk of not being able to take a full withdrawal for spending to my age 90.


You also get a bonus feature with FIRECalc: you see complete range of portfolio values for all the sequences it builds, and it gives your ending portfolio balance if you rode the expected sequence of return. If your investing cost is not too high, that result is always more than you started with!


== What’s MOST HORRIBLE look like? ==


I am not one to trust someone else – FIRECalc – to show me a result for something as important as my financial retirement plan without understanding the details. I wouldnt be eliminate the uncertainty of market returns if I did not trust FIRECalc’s choice of the MOST HORRIBLE sequence of return.


FIRECalc constructs sequences of returns we may face by using the historical record of stock and bond returns in the order that they occurred. I can easily find the data sources it uses on stock and bond returns. I can construct the same math it does to show how long a portfolio lasts to verify its accuracy (I did that here.) And I can see details of the worst sequences of return. (You see examples here and here.) Wow, they look really bad to me. Our brains forget how bad it’s been at times in the past. I conclude the worst sequences are breathtakingly bad. They are so bad that I conclude I don’t have to construct hypothetical, worse sequences for my planning. I’m comfortable that my plan truly uses a MOST HORRIBLE sequence of returns.


== Answers I give ==


It’s the hockey stick. It’s the hockey stick. My image of our plan is a hockey stick. The shaft of the stick is the number of years of zero chance of depleting my portfolio. That was 19 at the start of our plan about five years ago. I’ve LOCKED in that point. The only thing that could make it fewer years is worse than MOST HORRIBLE returns, and I’m sure that’s basically impossible. (Patti and I could screw up and exceed our Safe Spending Amount or increase Investing Cost, but we’re sure not going to do those things.) The blade angle is the rising chances of depleting in later years. The first year I have a chance of depleting is so far away that odds, unfortunately, do not favor that either Patti or I are alive then.


Someone may ask about my mix of stocks and bonds. I tell them my mix is 85% stocks. They typically say, “Whoa. That seems really risky.” I immediately know they don’t have the image of a hockey stick in their head. We’re not going to connect on this point.


My answer is, “The amount I spend each year gives me zero chance of depleting my portfolio to at least age 90. It’s only about 15% probable that I’ll be alive then. Do you think my choice of age 90 is too risky?” They generally have no response or mumble some kind agreement that 90 is Okay. But I know their brain is stuck on the view of one-year decline as their model of risk while my brain sees my hockey stick.


== Why 85% and not 65%? ==


If you decide your Safe Spending Rate based on a portfolio of 85% stocks, switching then to a mix of 65% buys you NOTHING. You already have ZERO chance of depleting, and you can’t get below ZERO chance of depleting.


But a lower mix of costs can cost you. We’re ALWAYS better off with a greater mix of stocks when the sequence of returns we face is not MOST HORRIBLE. We’ll have much more in our portfolio. That means we have more chances to Recalculate to a greater Safe Spending Amount (See Chapter 9, NEC). Or if we never changed our annual spending amount, we’d accumulate far more for our heirs. Patti and I could accumulate $400,000 more per starting $1 million Investment Portfolio.


Conclusion. A financial retirement plan with 65% mix of stocks is not inherently safer than one with an 85% mix of stocks. With Nest Egg Care you make the three key decisions that LOCK IN the number of years you know your portfolio will give you a Safe Spending Amount. That’s ZERO risk in my view.


Your plan should start with the input of 85% stocks. You don’t gain lower risk if you then have second thoughts and move to a lower mix of stocks. You can’t go below ZERO risk. The lower mix just means you will accumulate far less if the future sequence of stock and bond returns is close to expected returns.


You plan looks like a hockey stick. Few have this image in their head. Most everyone will look at you strangely when you tell them your plan has 85% stocks. You may have doubts. If so, start out at a lower mix, say 75%. Stick with it for a couple of years. Get comfortable with your plan and your Safe Spending Amount. Then move up to a greater mix of stocks.

Will your heirs get $thousands less from your inherited IRA?

A possible change in tax law would require heirs of our IRA to fully distribute them over fewer years. The change, described here, (“… It Could cost Your Kids Thousands.”) would require that our IRAs be fully distributed within ten years of our death. Here’s another article that describes the effect as a “confiscatory death tax mainly on … middle-class [and] is egregious.” Will this cost our heirs $thousands? Yup. But is this unfair and confiscatory? I offer my views in this post.


== Two issues are at play ==


1. Under proposed law tax-free growth on my IRA after death would be shortened by decades. As I describe here, the big advantage of an IRA is tax-free growth. You avoid gains taxes – primarily capital gains taxes – on growth of your contribution for as long as you keep your money in your IRA; you’re compounding growth without the drag of taxes. Once you withdraw an increment, you end its tax-free run and then, in essence, all future growth on that increment is taxed at 15% capital gains rates. This lowers your real return rate by 15%. Example: the real expected growth rate of my IRA is 6.34% per year. Once my money is subject to capital gains tax, my expected growth rate is 5.39% (85% of 6.34%). Money compounds to roughly 15% less over time.


2. Under proposed law, our heirs will pay a greater marginal tax than they would under current law. Most of us have Traditional IRAs and small or even no Roth IRAs. I started contributing to my IRA in 1981 and only Traditional was available. Certain types of plans that I contributed to over the years (SEP-IRA) were only Traditional. Roth first became available in 1997, and I had already made the bulk of my contributions. While I have converted some Traditional to Roth, I’m basically 100% Traditional. I’m therefore sensitive to the marginal tax rate I pay when I withdraw. I would like that rate to be as low as possible. I certainly don’t want to bump into a painful marginal tax rate that I could otherwise avoid.


== #1. Tax-free growth: 10 years vs. 80 years ==


Under current law when you leave your IRA to a non-spouse beneficiary, it continues to exist for ~85 years less the age of beneficiary at your death before the final withdrawal depletes it. Last week I used the example of how my IRA existed 50 years in my lifetime and would exist 30 more years for my hypothetical, non-spouse beneficiary age 55. If I had left my IRA to a beneficiary age one, my IRA would have existed more than 80 years after my death! I think of my 1981 contribution: some part of it would grow tax-free for 50 years in my lifetime and 80 years thereafter: 130 years of tax-free growth!


Yes, shortening the maximum number of years of tax-free growth to ten years after my death means that tax-free growth runs fewer years and capital gains tax on growth kicks in earlier.


But I don’t have a problem with this. The idea of my IRA lasting and growing tax-free for 80 years after I’ve died is crazy. Ten years after I’ve died seems much more rational.


Also, Patti and I want our heirs to be able to use money that we can leave them earlier not later – we’d ideally like to get most of what we’d like to leave them while we are alive. I like the thought that they are able to use more money when they are younger. We want our heirs to use what we can leave them to make a difference in their lives SOONER, not later. Maybe they’d use the money for their kids’ education; take far better family vacations; spend to improve their home; or contribute to their own IRAs. I have no problem in them getting it all from my IRA (withdrawing it all) in ten years.


Actually, I recoil a bit at the thought that my IRA is going to hang around for decades after I’m dead and be, in effect, a very large part of an heir’s retirement plan. I don’t see that as our responsibility.


== #2. Income in a higher marginal tax bracket ==


This is the problem of 1) a large initial Traditional IRA that grows because expected returns are well below RMD percentages for many years; 2) RMD percentages that eventually are large; and 3) leaving your IRA to too few heirs. Those factors combine to result in large RMDs for an heir – perhaps so large it throws him (her) into a painful tax bracket that he would otherwise avoid.


We may have this problem: it’s not limited to our heirs. At expected returns for stocks and bonds, our RMD will be twice our first RMD as I describe here. That’s from the play of factors 1) and 2) above. Example: When I am 82 my RMD (about $73,000 in this example) will be about twice my first (about $36,500). My IRA at age 85 ($1.24 M) is 24% more in spending power than it was at my age 70 ($1 M). Note: Through my age 85 I withdraw roughly $930,000 and have a balance of nearly $1.25 million. Nice result from that $1 million start!


Depending on the size of your beginning IRA, an RMD that is twice what it was at age 70½ could throw some part of your income into a painful tax bracket. The painful transition is from 24% to 32% marginal rate. You keep 11% less on the part that falls into the 32% marginal bracket.


This problem of some part of income falling into too high marginal tax bracket is limited to folks with very large IRAs and therefore very high RMD: the trip point that starts the 32% marginal tax bracket is over $310,000 taxable income for married, joint filers. (That’s nearly $340,000 in gross income.) I think we’d all like to have this problem.


Under current tax law, my heir will have larger RMDs from my IRA than I will have. I used the example last week of an heir age 55. She may fall in into a marginal tax rate that she really would not like for MANY years.


Her $1.24 million Inherited IRA has 24% more spending power that it had at my age 70. Her initial RMD percentages are well below the expected return rate and her Inherited IRA grows in real spending power. It grows to be much bigger than mine ever was: oh, the power of compound returns and time.


When she is age 66, her RMD ($85,000) will be greater than mine at age 85 ($84,400). When she is 77, her RMD will be double and it will eventually be triple this amount. It gets so big that it alone almost places her in the 32% marginal tax bracket. And this is on top of RMDs she’ll be taking from her own Traditional IRAs and Social Security and other income. Wow!


My heir will have this problem under proposed law. If my heir has to fully withdraw from my IRA over ten years, she’ll have at least one large withdrawal that will result in very high taxable income. The simplest way to see this is to assume my heir age 55 sticks with the RMD schedule under current law. That means no difference relative to current law for nine years. But then at the end of the 10th year she withdraws the final balance – a total withdrawal of +$1.6 million.


She’d pay 37% tax on taxable income greater than $510,000. (The chart is in $constant and brackets adjust for inflation, so that’s an accurate statement.) She’d keep 63% of the total. If she otherwise would have been in the 24% bracket she would have kept 76% of the total. The added tax cost results in roughly 17% less for her.


My guess is that the impact over ten years is a lot less dramatic than 17% difference. With planning she can lower this impact: withdraw more earlier so less is taxed at that very high marginal rate. I can’t easily compare this to the tax effect under current law because I can’t reasonably estimate the tax impact of those high RMDs for 20 years – her age 66 to 85.


I don’t get agitated about this problem. This affects very few of us in my opinion. This would be a nice problem to have and to work to solve. Also, total withdrawal of your IRA in ten years has much less tax impact – perhaps no impact – if you leave your IRA to more heirs.


Think of this way: you start out with a $1 million IRA. You withdraw +$900,000 to enjoy in 16 years. Let’s assume that’s the balance of your lifetime to age 85. And then your heirs get to withdraw $2.1 million in the next ten years to enjoy in their lifetimes. Wow! I really like that.


Conclusion: Proposed tax law may require our heirs to totally withdraw the total in the IRA they inherit from us in 10 years. That is decades shorter life than current law. Shorter life means fewer years of tax-free growth and an earlier start on capital gains tax on growth. That’s a loss relative to what seem crazy to me: my IRA could exist and grow tax-free for 80 years after I died.


Greater annual withdrawals from higher RMDs could throw (us and) heirs into a marginal tax bracket that they really don’t like. That could happen under current law and proposed law. High marginal tax on withdrawals is an issue for the rare few of us with large IRAs and few heirs.


The bottom line for me is this. You start with $1 million. Under proposed law and expected rates of return, you withdraw +$900,000 to enjoy in your lifetime. Your heirs withdraw $2.1 million over the next decade. They get to enjoy twice as much as you did. You have to like that.

How many decades will your IRA enjoy tax-free growth?

A possible change in tax law would cut the number years our IRAs that we leave to our children or other heirs will grow tax free. The change, described here, would require that our IRAs be fully distributed within ten years of our death. Under current law my IRA that I leave to an heir could easily exist for 30 years after I’ve died. Some part of my first contribution to my IRA in 1981 grows tax-free for 80 years! That part will have grown by 256X in real spending power. This post explains how under current tax law I get 80 years of tax-free growth on my first contribution to my IRA in 1981.


Last week I discussed the two basic advantages of IRAs.


• You get to play the game of different tax rates. A difference in your marginal tax rate 1) when you contribute and 2) at time you withdraw can mean you net more to spend than if the marginal rates were the same at both those times.


• Your IRA nets you more to spend than the alternative of keeping it invested in a taxable account because you are avoiding taxes – primarily capital gains taxes – for all the years your contribution is in your IRA. Each withdrawal from your IRA ends that tax-free run on that amount.


I calculate that tax-free growth is the greater benefit of the two, and I focus on this effect in this post. I’ll address the issue of marginal tax rates that heirs may pay from greater annual distributions (over 10 years vs. 30 or more years) – which seems to have alarm bells ringing for some – in the next post. The immediate question to answer:


• How do I get an 80-year run of tax-free growth on some part of my first contribution to my IRA in 1981 and what happens to it over time? We’ll follow what happened to that first contribution in 1981– the bottom layer in my total IRA – in this post. You’ll get the idea of what happens to all the other contributions.


== My first 33 years of tax-free growth ==


I made my first contribution – $2,000 – to my Traditional IRA in 1981. My 1981 contribution grew tax-free for 33 years to 12-31-14 before I was first required to withdraw a part in 2015 for my Required minimum Distribution (RMD).


I know invested my 1981 contribution in a stock fund that returned no less than the index fund VFIAX – one of the few that existed in 1981. Using VFIAX as the measure, my $2,000 in 1981 was about $71,400 on 12-31-14. That’s a combination of real growth and inflation. Let’s drop inflation and state all future dollar values in the constant dollar spending power of 12-31-14.


== RMD and the next 17 years ==


My first four years of RMD. My first RMD of 3.66% in 2015 was based on the value of my IRA on 12-31-14. My four RMD withdrawals have averaged about 3.8% per year. Real returns on my portfolio have averaged 5.9% per year. (If you follow the investment advice in Nest Egg Care, that also would have been your real return.) My portfolio has grown in real spending power by 2% per year and was 8% greater on 12-31-18. The $71,400 on 12-31-2014 increased in real spending power to $77,300 by 12-31-2018.


The balance of my lifetime. At expected return rates for stocks and bonds and my low investing cost, my IRA will continue to grow in real spending power for about the next ten years. I described this in this post: RMD percentages are less than the 6.34% expected real return rate for my portfolio through 2028. In 2029 – my age 84 – the 6.45% RMD percentage – first exceeds the expected return on my portfolio.


At the end of 2030 the value of the remaining part of my 1981 contribution to my IRA is $86,800 measured in 2014 spending power. That’s +20% from 12-31-14.


== The next 30 (or more) years ==


Let’s assume I name a non-spouse heir as beneficiary of my IRAs. I’m simplifying here; of course Patti is the first beneficiary of my IRA, but let’s assume I leave it to a non-spouse heir.


Assume I die at age 85 in 2030. My IRA passes to an heir age 55. My IRA is then subject to an RMD schedule that is different from my RMD schedule. Her RMD applies to both Roth and Traditional IRAs, ending the run of tax-free growth on the amount withdrawn.


In the first year she must withdraw based on her Life Expectancy Factor from that table: 29.6. That translates to an RMD of about 3.4% (1/29.6) in 2031. That’s about half the percentage I took the year before. Her RMD in future years calculates by subtracting 1 from her starting 29.6 Life Expectancy Factor. Her RMD percentage increases fairly steeply each year. It first exceeds the 6.34% expected return in 2045 when she is 69. My IRA is fully depleted in 2061, 80 years after its start.


At expected returns my heir will see my IRA increase in real value to $112,100. That’s 57% more than on 12-31-14 – 30 years earlier. In this example, some part of my initial contribution has ridden 80 years tax-free growth at 7% annual returns: that’s eight doublings or real grown in spending power of 256X. Whew! All this from one $2,000 contribution in 1981!


If I left my IRAs to a younger heir, that heir would see more years of real growth in my IRA and my IRA would be depleted after 2061. If my heir was age 30 at my death, my IRA would run 55 years to 2086! A total of 105 years. That is more than ten doublings for some part of my initial $2,000: far more than 1024X in real spending power.


Conclusion: A possible change in tax law could limit the number of years that an IRA we leave to an heir can grow tax-free. An inherited IRA would have to be fully distributed within ten years. This post explains how under current law my IRA could exist 30 years or more (!) after my death and for a total of 80 or more years: a part of the $2,000 I contributed in 1981 grows tax-free for 80 years. At expected return rates some part of my initial contribution will increase in real spending power by a factor of 256X.