Why wouldn’t you decide to be in the top 6% of all investors?
Posted on May 3, 2019

I would think most retirees would be ecstatic if they knew they could be in the top 6% of all investors, and they can. But an amazing percentage of investors make decisions – or fail to make decisions – that would put them at the 94th percentile of investors. You will have $10,000s more – perhaps $100,000s more – from Index funds relative to the average Actively Managed fund. This posts restates the evidence that you can decide to be in the top 6% of investors: stick with index funds.
The post is an update to my post of about ten months ago. I summarize the information from the latest SPIVA® U.S. Scorecard for the period ending December 31, 2018. SPIVA is a report of S&P Dow Jones Indices, Inc. S&P Dow Jones produces and sells measures of stock and bond performance (indices) to investment firms who want to use them as benchmarks of performance. It publishes the Dow Jones Industrial Average® and the S&P 500® index and many more.
SPIVA is the abbreviation of S&P Indices Versus Actively managed mutual funds. It compares how well Actively Managed funds perform relative to their benchmark index. SPIVA is a very thorough and objective 37-page report. Comparing performance can get tricky since poorly performing funds disappear over time (close or merge with others) and the methodology in this report accounts for the performance of non-survivors over time.
Morningstar displays the rank and performance of a fund relative to others in its category or style. But I don’t think Morningstar is accounting for the funds that no longer exist. You see this in Morningstar’s count of a much smaller set of funds in a category or style, say, 10 years ago as compared to now. When you only include today’s survivor funds in the comparison for performance over the last 10 years, you have tilted the population of funds to the surviving, more successful Active funds. That means for longer time periods Morningstar will rank an Index fund lower and rank a current, surviving Active fund higher relative to the SPIVA methodology.
== The Conclusions ==
The resulting data in this SPIVA report is almost exactly the same as in the prior report. The conclusions are the same. Bottom line: you can decide to be in the top 6% of all investors. You eventually will be at the 94thpercentile if you invest in Index Funds. If you try to to be better than the 94thpercentile, the probabilities are against you: you will wind up much worse.
1. Calendar 2018 was the ninth year in a row that a majority of actively managed funds failed to lag a broad index for the total market. In 2018 69% of actively managed funds failed to beat this index. This was the fourth worst performance since 2001.
2. Over a 15-year period, about 94% of all Actively Managed funds failed to outperform their peer benchmark index. That’s the same percentage from the report of 18 months ago. I’m still surprised that nearly 80% of all Actively Managed funds underperform their benchmark in just three years. What a bad track record!
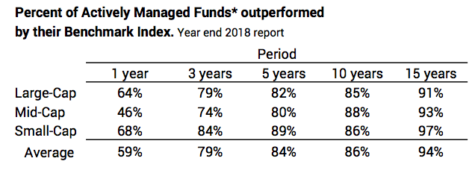
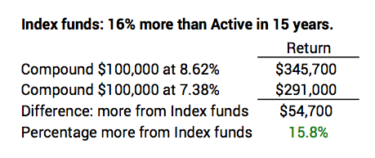
3. On average, Actively Managed funds return about 1.2 percentage points less per year than their peer benchmark index. That’s the same deficit as in the last report. Using historical returns in this latest report, in 15 years you will have about $50,000 more from Index funds relative to each starting $100,000. You will have a lot more money if you stick with index funds.
4. Even an Actively Managed fund that performed well did not beat its peer index. An Actively Managed fund at the 75th percentile over 15 years (the breakpoint to be in top 25% of all funds) underperformed its benchmark index by about .5 percentage points per year. (I don’t show the data for this. Trust me. It’s true.)
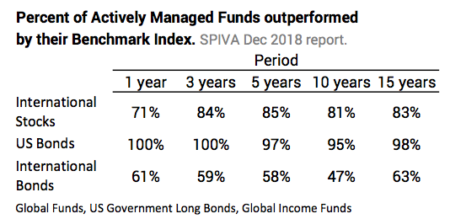
5. The poor performance of Actively Managed US stock funds holds true for International Stocks, US Bonds and International Bonds. The worst of these is US bonds: none(!) outperform their peer index over one or three year periods, for example.
== You’ll be better than Top 6% ==
The SPIVA report shows that a single Actively Managed fund has a 6% probability of beating its benchmark index (averaging over all funds for 15 years). A typical investor won’t just own one. Let’s assume a typical investors owns four of these funds. (It’s probably many more than this.) The probability that all four will beat their benchmark index is about .001%: hold just a few Active funds and the probability of outperforming a broad market index fades dramatically. Stated differently: if you hold a broad-based Index fund, you’ll almost certainly be Much Better than the 94th percentile of all investors.
Conclusion: The two SPIVA reports I’ve looked at over the last year give the same conclusions: you can be at the 94thpercentile of investors over time by investing in Index Funds. (I argue you’ll rank much higher than this.) It’s folly to invest in Actively Managed funds: 94% fail to beat their peer index fund over a 15-year period; the average Actively Managed fund returned about 1.2 percentage points less per year. The cumulative effect is that Index funds return many $10,000s more – about 19% more. We retirees cannot afford to play our game with Actively Managed funds.