How much more are you making from the recent decline in Investing Costs?
Posted on May 24, 2019

We all pay costs to invest. The amount we pay each year – our Investing Cost – lowers the amount we get to keep from the gross returns the market, in aggregate, provides all investors. Patti and I pay a predictable, small amount and our cost declined in February. This post examines how much less we will pay and how much more will be in our pockets. Answer: our Investing Cost dropped by 12% but that translates to just $50 per year per $1 million portfolio. A dollar a week. Small, but we’ll take it! (See Nest Egg Care (NEC), Chapter 6 for more discussion on Investing Costs.)
== Cost reduction last August ==
Last August our Investing Cost declined by 30% from about 7% of 1% of our portfolio value to about 5% of 1%. That was driven by Fidelity’s lower cost for the US Total Stocks fund that we own: FSKAX. It’s cost is 1.5% of 1%; that’s really low.*
== Cost reduction this February ==
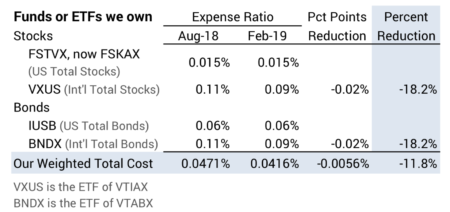
Vanguard lowered their cost on a number of funds and ETFs by about 20% in February. This included two that we own. This translated to about a 12% total cost reduction for us.
What do we pay now? What fewer dollars do we pay? What more do we get to keep? There are a lot of decimal points to fight through for this calculation. I have to fight through calculations like this time and time again, because I don’t have the dollar amount we pay anchored in my head yet.
• I will be simplest for me if I state our Investing Costs in terms of $ per year per $1 million total portfolio. I can quickly go from that to the rough total we pay for our total portfolio. My friend Steve uses ¢ per $1,000 portfolio for his calculation; my brain does work easily with that starting point.
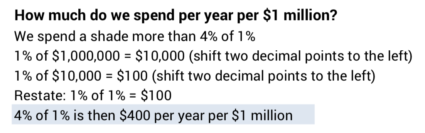
• It’s simplest for me to start understanding 1% of 1%. We now pay about 4% of 1%. I just have to plant 1% of 1% of $1 million in my head and then multiply by four. 1% of 1% of $1 million is $100. We pay about about $400 per year per $1 million.
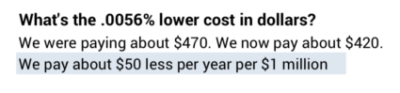
How much did we save. I’ll get a headache if I start with that .0056%. Easier for me: we used to pay about $470 and now pay about $420. We pay $50 less per year per $1 million invested. $1 per week. Peanuts, but we’ll take it!
== A different look at the $50 ==
Here’s another way of looking at this: your financial retirement plan looks like a Hockey Stick and a Pile of Money. The shaft length of the stick is the number of years you’ve picked for zero probability of depleting your portfolio; that’s based on the assumption of the Most Horrible sequence of stock and bond returns in history. The Pile of Money is the amount you would have if the sequence of returns you face is not Most Horrible.

Lower Investing Cost always lengthens the shaft length of our hockey stick and always increases the Pile of Money. But $50 per year per $1 million portfolio has a very small effect on shaft length – you can count the lengthening effect in terms of days – and on the Pile of Money.
== Planting $400 in my head ==
I think I’ve done this calculation enough times that I should have the roughly $400 we pay planted in my head. But I don’t. Drawing this image is going to help with that. Go ahead. Draw one a picture like this if you have a hard time remembering your Investing Cost.
image
== What do these lower costs mean to you? ==
I bet that few retirees calculate their Investing Cost – fighting through the percentages is not easy – and then translate the percentage they pay into dollars. The financial industry just loves this: customers are in the dark as to what they pay! – even though they’ve been given the numbers to be able to figure it out. (See Chapter 6 and Appendix F in NEC and the spreadsheet in Resources on the home page to help with your calculation.)
I have friends who are paying $20,000 (2%) per year on this same basis and would have no idea that someone could pay $400. I think: “What an ugly looking hockey stick. What a puny Pile of Money. Patti and I are having a lot more fun with $19,600 per year than they are.”
Conclusion. If you are invested in Vanguard funds or ETFs, you are now paying lower Investing Cost than at the start of the year. The reduction was about 20% per fund/ETF. The weighted cost reduction for our total portfolio was about 12%. We were already low in total Investing Cost: we were paying roughly $450 per year per $1 million portfolio. The 12% reduction is about $50 per year less. We get $1 more per week! But we did no work for this. We’ll take it.
* Fidelity introduced two total market funds for their customers that have 0% Expense Ratio: FZROX and FZILX. I mentioned them here. I’m watching their net performance – net return – for investors to see if I should switch into them. Their construction – number of securities they hold, for example – do not match other total market funds, such as FSKAX or FTIHX at Fidelity or VTSAX or VTIAX at Vanguard. Other fund families have similar offerings.