Did Energy and Food inflation slow in April?
Posted on May 15, 2026

The food and energy components of inflation were very high in April, but were a bit less than the jump in March. They are the obvious contributors to recent inflation. We most clearly see this when we compare two inflation measures: Seasonally-adjusted inflation includes food and energy, and March+April’s rate runs at 9% annual inflation. Core Inflation does not include more volatile food and energy components, and March+April’s rate runs at 3.4% annual inflation.
I display a table and graphs that I use to follow the trends in inflation. I add a graph on wage growth. Recent wage growth is much less than inflation.

Details:
The two most widely-reported measures of inflation are Seasonally-adjusted inflation and Core inflation.
Seasonally-adjusted inflation is the most widely reported measure of inflation. April inflation was at an annual rate of 7.2%. Inflation for March+April was at 9% annual inflation rate. The six-month rate jumped more than one percentage point to 4.7%. The 12-month rate is 3.8% and is the highest in three years.

Core inflation excludes volatile energy and food components. The increase in April was at an annual rate of 4.5%, the highest for the last 15 months. Inflation for March+April was at 3.4% annual rate. The six-month rate runs at 2.8% inflation, and the 12-month inflation is 2.7%. These are about the same or slightly better than the last two years.

Personal Consumption Expenditures (PCE) excluding Food and Energy is the measure of inflation that the Federal Reserve Board favors. This similar to Core inflation, but this measure shows higher inflation. (It usually shows lower inflation.) The last six months average 3.7% inflation and the last year was 3.2%.

== History of 12-month inflation rates ==
Full-year inflation measured by CPI-U jumped to 3.8% from 3.3%. The prior 21 months inflation averaged 2.7%.

I include a graph that shows the monthly trends. Inflation for March and April were twice that of any of the past 15 months. March+April is the highest in four years.

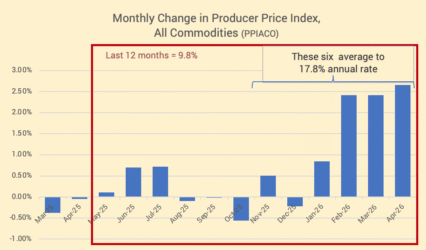
== Producer’s Price Index ==
The PPI increased by 2.7% in April! The last three months are at an average rate of 30.7%. The last six months average to 17.8% annual rate.
== Services ==
Inflation for services increased sharply in April. The rate for the last six months average to 3.5% annual rate. The 12-month rate is 3.3 %.

== Wage Growth ==
Wage growth the last two months averaged to less than 2% annual rate. Wage growth in March+April was the lowest in six years.

Conclusion: Inflation measures released this week for April again showed high inflation from the volatile food and energy components. The inflation measures the Fed favors does not include food and energy and is running at about 3.7% annual rate. We clearly are not trending to the Federal Reserve’s goal of 2% annual inflation.