Why MUST Actively Managed funds in aggregate underperform Index funds?
Posted on May 25, 2018
Two weeks ago my blog post discussed the performance of a set of Actively Managed US Stock funds as compared to their peer index funds. I cited this study in another post. I discussed this with an investment pro who DID NOT GET the fact that IN AGGREGATE actively managed funds MUST underperform the Index fund by the difference in their costs (primarily Expense Ratio). Try as I might, he did not understand. Maybe he didn’t want to understand, since his business is based on selling his ability to pick Actively Managed funds for his clients. Maybe I was not clear enough.
The post provides a painfully more detailed story of why the statement is true. You can also see and print the story in one picture. This is a BIG DEAL – perhaps worth $250,000 for you – as you will see. (Also see Chapter 6, Nest Egg Care.)
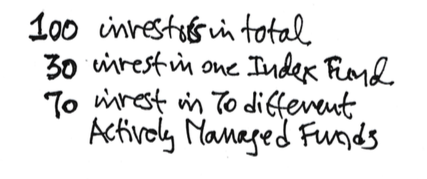
The Set Up. This is obviously a simplified structure of investors and stocks. It’s a valid picture. This story lasts one year. We have 100 investors: 30 invest in one Index fund (does not trade stocks that are part of its portfolio) and 70 invest in 70 different Actively Managed Funds (those that trade stocks often to pick winners and rid their portfolio of losers).
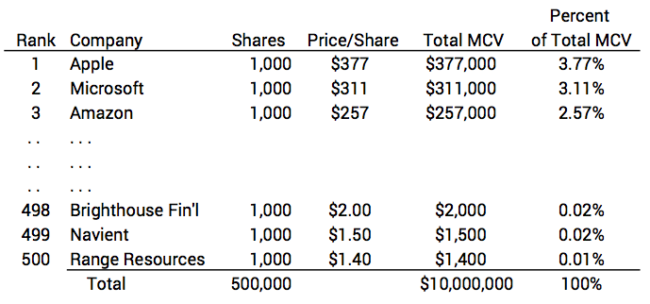
The total stock market consists of 500 companies. Each company has 1,000 shares of stock. That’s 500,000 shares in total. The number of shares for each company (and the total) does not change. Stock price can change and therefore the Market Capitalization Value (MCV) can change for each company and in total. MCV = total shares * price/share.
At the start of the year, the average price of all shares is $20/share. That makes the total MCV of all shares $10 million (500,000 shares * $20/share).
The range of price of shares and therefore the MCV of individual companies is quite wide. Higher priced shares (companies with greater MCV) account for a much greater percentage of the $10 million of total MCV than others. Here are the top three companies and the bottom three out of the 500.
During our year the price of each stock changes. On average, prices increase 10% to an average of $22/share. Some increase by more than 10%; some increase by less; some decline. The MCVs of most all the companies change. The ranking of individual companies from greatest MCV to least changes. But in aggregate the total MCV of all the companies increases by 10% to $11 million (500,000 shares * $22/share.)
What do investors hold at the start of the year?
• The big Index fund holds 30% of the shares of each stock; 300 shares of each company. That’s a total of 150,000 shares and total market value of $3 million. Each of the 30 investors owns an equal amount of the fund. In effect, each owns 10 shares or 1% of each company and 1% of the total MCV of all. That’s a market value of $100,000.
• The other 70 investors each own one Actively Managed fund, and each fund starts out identically to each of the shareholders of the big Index fund. Each fund owns 10 shares or 1% of each company; that’s also a market value of $100,000. All the funds together own 700 shares of each stock; 350,000 shares in total with a total MCV of $7 million.
What do managers of these funds do during the year?
• The manager of the Index fund does very little. He’s performing the administrative task of maintaining the ownership records of the 30 investors. He does not buy or sell any shares during the year. At the end of the year, the Index fund still holds the same 300 shares of each stock – the same 150,000 shares in aggregate.
The value of stocks increased by 10% on average in the year. While some went up and some went down, the Index fund still holds 30% of each. Value increased by 10% or by $300,000. Ending value was $3.3 million.
• The active fund managers freely trade shares among themselves. Managers knock themselves out in the effort to buy more of what each thinks will be winners and unload those each thinks will be losers. The Index fund manager doesn’t buy or sell a single share, so the Index fund isn’t part of this game. An active fund manager can only buy from another active fund manager who sells.
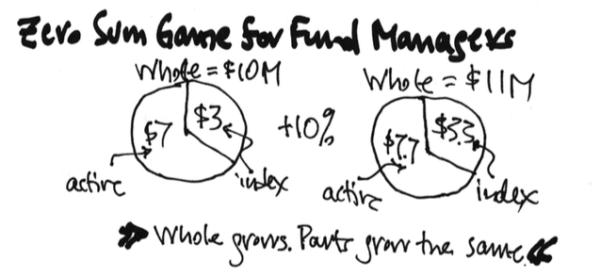
The value of stocks increased by 10% on average in the year. All the funds in aggregate still hold 70% of each and 350,000 shares. Value increased by $700,000. Ending value was $7.7 million.
This is the ZERO SUM GAME: both index fund and active fund managers increased in aggregate by the same percentage during the year before costs they incur. There’s a whole and two parts. The percentage of the parts does not change. The whole grew by 10%. Each part grew by 10%.
====
But the number and nature of shares of each Active fund changed. During the year, for example, some fund managers sold a few of the really high priced shares priced shares to buy lots of lower priced shares in an effort to overweight their holding with smaller company stocks. Some sold lots of shares of smaller company stocks to buy more of larger company stocks. Some sold to be able buy more technology shares. Some sold to buy more stocks that pay a high dividend. And so on. But every time someone bought, someone had to sell and vice versa.
The result is varied portfolios for each fund. But in aggregate all funds still own 700 shares of each company and 350,000 shares in total. They all stated out with the same $100,000 value and the average value at the end of the year for all the funds is $110,000, but individual funds will have more or less than this value. Some managers made the right decisions or bets and held more of shares of stocks that increased by more than 10%. Those who made the wrong bets did worse. Those who increased in value by more than 10% did so at the expense of those who did worse. The only source for outperformance is from the underperformance of other actively managed funds.
====
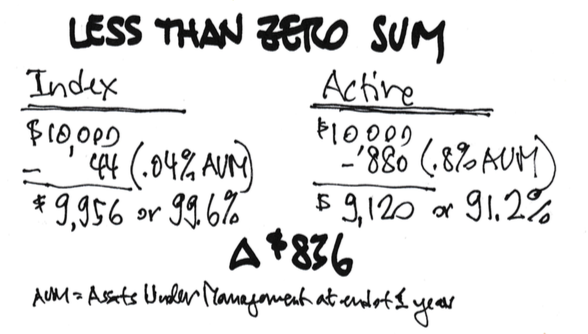
Investors are dealt a LESS THAN ZERO SUM GAME: the return to investors, in aggregate, is less from Actively Managed funds exactly by the amount of their increased costs.
• The Index fund charges its investors .04% of the assets under management. At the end of the year, its total fees – a deduction from total value of the fund – are $13,200 (.04% X $3.3 million). That works our to $44 per shareholder in the Index Fund.
The increase in value of the Index Funds before the deduction of costs was $10,000 for each owner of the fund. After the deduction of the $440 fee, each investor received $9,956. That’s 99.6% of what the market gave before costs.
• Active fund managers charge (on average) 0.8% of assets under management. That’s 20 times that of the Index fund. At the end of the year, their total fees in aggregate are $61,600 (0.8% X $7.7 million). That works out to $880 per investor.
The increase in value for all the funds in aggregate before the deduction was $700,000 or $10,000 per investors on average. After costs they received $9,120. They received 91.2% of what the market gave before costs. They received $836 less on average than each Index fund shareholder.
(Some of the investors in these funds hired other advisors to help them pick the Actively Managed fund to invest in. If this was an added fee of one percentage point, those folks received 80% of what the market gave to all investors before costs.)
====
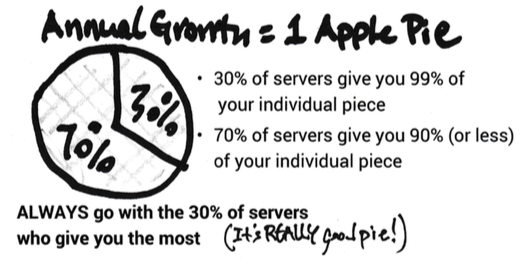
It’s very tough for an individual Actively Managed fund to overcome its higher cost and outperform an Index fund. It can only do this if other Actively Managed funds do very poorly, and they all are trying to outperform. Over 15 years about 19 in 20 US stock funds cumulatively underperform their benchmark index fund.
If you go Active, just to breakeven relative to your friend who’s a shareholder of the Index fund, your pick has to be no worse than the of the top 5% to 7% of the bunch. If your pick of an Actively Managed fund is average in the pack, you keep about .8 percentage point less per year than your friend. Over a retirement horizon of, say, 15 years and average returns, that is more than $250,000 LESS FOR YOU (stated in constant purchasing power) per starting $1,000,000 invested. This is a BIG DEAL!
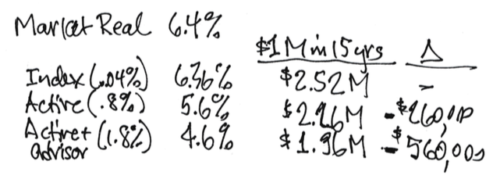
Conclusion. The math of all this is pretty darn simple. Index funds and Actively Managed funds own part of the the total market. Both parts rise and fall by the same percentage in aggregate. Index funds return to investors a very high percentage of what the market gives all investors before costs: their costs are as low as .04%. Actively Managed funds return less; the amount they return less is the difference in their costs (.8% vs .04%). At expected real return rates, that difference compounds in 15 years to perhaps $250,000 relative to a $1 million starting investment; that $250,000 is stated in constant purchasing power.