What happened on December 15, my day bottling the wine I’ll drink next year?
Posted on December 21, 2018
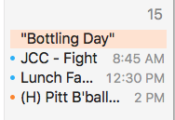
This is my imagined workday every December 15. I even mark this day as “Bottling Day” on my calendar. I imagine that I dress warmly for my annual work task out in our garage. The high was 46o this year, warmer than in recent years, but rainy. I described my workday in some detail in my post last year.
What really is happening this day? At this time of the year, I rearrange the display of our portfolio returns. I don’t want to view our portfolio as one big pile of money that goes up or down with market returns: that can cause unneeded stress and worry. I clearly keep stocks in separate accounts from bonds, so I see how those two individually perform. That helps. But I also want to view the total grouped by holding period. Holding period is the number of years one holds an investment before selling it for spending. The purpose of this post is to display our portfolio results by my imagined grouping of holding periods.
Why do I do this imaginary task each year? I want to reinforce in my brain that I have the least variation in returns or risk in the money I will spend over the next several years. That’s because that pile of money is mostly bonds. Focusing on the results in this short holding period helps to isolate my brain from concern, worry, and panic when the market declines.
The pile of money that has the longest holding period will have the greatest variation returns, because that pile is all stocks. I know I won’t touch any of that money for at least a decade. Whatever happens to that pile – steep dives or soaring takeoffs – will be tempered over time. I have plenty of time to recover when disaster strikes.
==== Wine barrels and the large vat ====
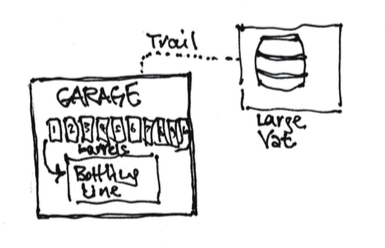
I imagine that our portfolio is in ten wine barrels in the garage and a large vat out back. Each barrel holds about one year of spending and the large vat holds the rest.
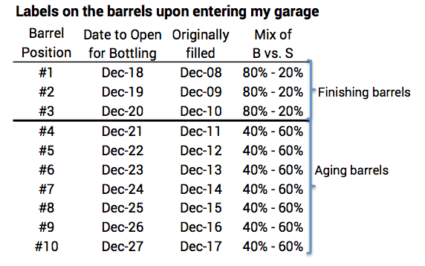
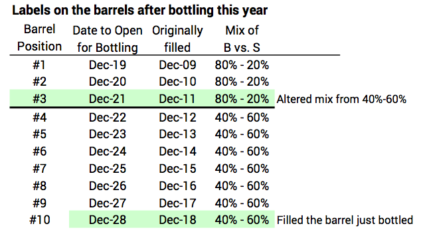
The barrels are grouped into two mixes of stocks and bonds. The first three barrels are the Finishing Barrels, and they’re invested at 80% bonds and 20% stocks. The means their volume should not change much year to year. The barrel marked “December 2018” sat with that mix for three years: it first was in the 80%-20% mix in December 2015. The next seven barrels are the Aging Barrels, and they’re invested in 60% stocks and 40% bonds. The barrel in the #4 position has aged at that mix for seven years now. Here’s what the labels on the barrels say as I start my task this year.
The Large Vat out back is 100% stocks. Patti and I won’t touch the first drop of that for a decade. We started putting money in that vat more than 40 years ago. I don’t exactly know the average age of what’s in there, but perhaps the wine we drink in any year has aged for a total of 20 years. That’s well-aged wine!
==== My task today ====
My task this December 15 was to open the barrel marked “December 2018” that is closest to the bottling line and to bottle its contents (sell its securities) for our consumption (spending) in 2019. After doing that, I then must roll the nine full tasks forward in position; I adjust the mix in the #3 barrel to 80-20 from 40-60. I move the barrel I just emptied to the #10 position and fill it with its correct 40-60 mix. When I’m finished, everything looks very similar to when it did when I walked in this year. The labels are now set for next December 15.
==== Volume changes over time ====
What were the volume changes this past year? This summary table shows this past year and the history over the past for years for the three groups of barrels. You’ll find more detail here.
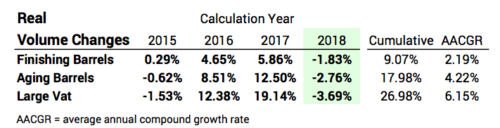
This was the first year that volume in the two groups of barrels and in the vat decreased. This year follows two years of very good gains in volume. The variation in volume changes over time are in the order one would expect: least for finishing barrels and most for the large vat. Over the last four years, the average annual volume gain has ranged from +2% per year for the finishing barrels to +6% for the large vat.
Conclusion. We shouldn’t view our portfolio as one big lump that rises and falls with market returns. That tends to make us too sensitive and too emotional when we are hit with bad variability in returns.
It helps to imagine our portfolio in parts related to different holding periods. That’s easy to do when one separately tracks stock and bond returns. Each holding period should have an appropriate mix of stocks and bonds. This example is three holding periods starting with 80% bond and 20% stock and ending with 100% stocks.
The money invested in the shortest holding period will have more stable returns. The money invested for the longest holding period – it will be more than ten years before you will spend one dime of it – will have more variable returns but almost always much higher average returns over time. We know that if we’re hit (or when we’re hit) with bad variability of stock returns, we have a decade or more to recover.