How Bad is the Sequence of Returns that drives our Safe Spending Rate to a low level?
Posted on September 14, 2018
We make key decisions that LOCK IN the number of years we want for no chance of depleting our portfolio. Our Safe Spending Rate (SSR%) always assumes we will face the most horrible sequence of financial returns in history – starting now – and guarantees no chance of depletion for those years. The most horrible, historical sequence of stock + bond returns I found was the one that started in 1969. (See Nest Egg Care, Part 1 and here.)
The purpose of this post is to look harder at that most horrible sequence of returns that started in 1969. Could I envision a worse sequence? That would mean I should not be 100% confident with our current SSR%. Or, would I conclude that the sequence is so horrible that I think the chances of experiencing a sequence like that is VERY remote? If so, I’d have more confidence that my SSR% is rock solid.
Here is my short summary: that sequence is SO BAD that I think it’s less than 1-in-100 chance that we will experience it, especially starting right now. (That 1-in-100 chance of occurring is basically implied by my favorite Retirement Withdrawal Calculator.) I have more confidence in our SSR% and therefore our annual Safe Spending Amount (SSA).
========
Here are the real returns for 20 years for both stocks and bonds and my observations.
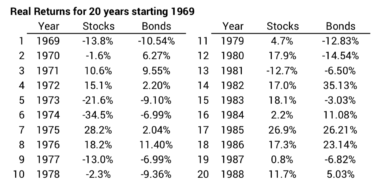
1. The economy turned against investors starting in 1969. Just from the point of economic conditions, 1969 was a particularly bad time to start withdrawing for spending from a portfolio.
• A retiree starting then was almost immediately hit with a recession. The first withdrawal for spending in 1969 would be at the end of 1968. Before the end 1969, the time for the second withdrawal for spending, the economy is in recession. (A recession is a contraction of Gross Domestic Project for two quarters in a row).
Over the first 14 years our retiree is hit with three other recessions. The recession that started at the end of 1973 was the third longest recession in history. Our retiree is hit again with another in 1980; and a fourth in 1981. Over 14 years, 48 months were in a recession. That’s record bad.
• This was also a period for record bad inflation. Inflation basically exploded from 2.7% in 1967 to 12.3% in 1974. Inflation averaged 7.5% per year for the 14 years from 1969 through 1982. That is more than triple the rate of inflation for all other years since 1926.
The combination of those two bad underlying economic factors is unprecedented.
2. Cumulative real returns for both stocks and bonds were below 0% for 14 years. This is the longest period I find with both stock and bond cumulative returns below 0%.
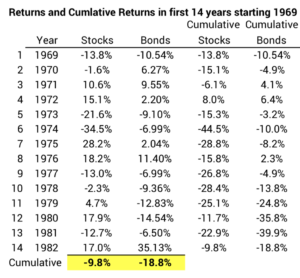
Over this complete period the cumulative return for bonds (-19%) was twice that for stocks (-10%). Most of us think bonds are going to temper the variability in stock returns – be better than stock returns when they are bad; this clearly was not the case, cumulatively, for this 14-year period. This really means that no mix of stocks and bonds was going to result in a healthy portfolio during this period.
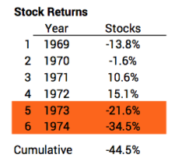
3. These 14 years contain several of the worst short-term bursts of bad returns. The first six years of this sequence were worst six-year return sequence for stocks in history – cumulative return of -45%. That’s much worse than the sequence that’s in second place. The two-year return for stocks 1973 and 1974 was -49%; that’s the second worst in history and much worse than the third place finisher. The return for bonds from 1977-1981 was -41% decline in real spending power (!) – its worst decline in history. See here and here for added detail.
4. Statistics tell us this return sequence is extremely improbable. We can use a statistical method (Standard Deviation) to describe the variability of return sequences and the probability of annual returns. Statistically the -22% stock return for 1974 is a 1-in-19 year event (probability), and the -35% stock return in 1975 is a 1-in-100 year event. The chance that two years like those occur back-to-back is about a 1-in-185 year event.
5. Late, great returns don’t save a portfolio from horrible beginnings. Annual returns for stocks and bonds in years 14, 17 and 18 in the sequence (1982, 1985, and 1986) were terrific, but portfolio value, which would also impacted by withdrawals for spending and investing costs, would be so low that the dollar growth from those return rates was too small for it to recover.
Conclusions. Nest Egg Care gives you the steps to decide on a Safe Spending Rate (SSR%) and therefore an annual Safe Spending Amount (SSA). Safety is defined as no chance of depleting your portfolio for as many years that you pick. The calculations always assume you will face the most horrible sequence of returns in history. As I examine the worst sequence that I find, I conclude it is incredibly bad. As an example, the economic conditions that led to those poor returns are unprecedented. I think we’d all agree that we are not remotely close to those conditions now and may never be. I am far more confident in our SSR% and resulting SSA. You should be, too.