How much safer is a mix of 65% than a mix of 85% stocks?
Posted on July 5, 2019
A financial retirement plan with 65% stocks is inherently NO SAFER than plan with 85%. A plan with 85% stocks can have NO RISK or uncertainty in the life of your portfolio – the number of years your portfolio will pay you a Safe Spending Amount. If you then change your design choice to 65% stocks, you are adding nothing to safety. You can’t get lower than NO RISK. It’s a mistake to then lower your mix: if we ride a sequence of returns that is close to the average we would expect, that low of mix of stocks costs you and your heirs a LOT of money. The purpose of this post is to explain how a plan with 85% stocks has NO RISK and is a better plan.
== What is risk? ==
Risk is uncertain, variable results that lead to financial loss. We retirees want to make decisions for our financial retirement plan that lessen uncertainty and the chance of loss.
The wrong picture of uncertainty and loss: I argue the typical retiree and financial advisor focuses on the wrong time horizon and measure of financial loss for us retirees.
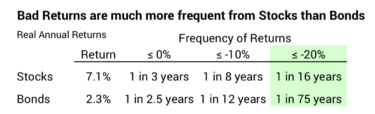
They focus on the chance of a one-year decline in the value of our portfolio. The annual expected real return for stocks (7.1%) is triple that for bonds (2.3%). [See here.] But one-year stock returns are about three times more variable in return. Very poor stock returns of ≤ -20% return occur about 1 in 16 years, while bonds returns of ≤ -20% occur in about one in 75 years. A mix lower in stocks always has less chance of portfolio decline in a year and therefore is less risky.
The investor just has to make a judgment on his or her personal comfort level – their emotional tolerance of a possible decline in the value of their portfolio, and then they decide on a comfortable mix of stocks. That’s the sole decision to lower risk.
The right picture of uncertainty or loss. The risk point I worry is about two decades away, and it’s a different definition of loss. I’m not unconcerned about a financial return that’s below 0% for a year, but my central concern is a multi-year sequence of really HORRIBLE annual returns that – in combination with the fact that I need to withdraw from our portfolio for spending – can destroy our portfolio.
At the start of our plan, my concern could be expressed as, “I want to know what’s safe to spend such that I DON’T RUN OUT OF MONEY for many, many years.” The loss I was worried about was a decline in my portfolio to the point it not longer would support another year of spending. I wanted our portfolio to be healthy enough to support a Safe Spending Amount year after year for decades.
That view adds a second factor to the risk equation: spending rate. That makes perfect sense: you have less risk if you spend less. Duh. How can those other folks ignore spending as part of the equation for risk?
== Eliminate the uncertainty of future returns ==
Once we eliminate the uncertainty of future returns in our planning, our Safe Spending Rate (and Amount) is clear.
We eliminate the uncertainty of future financial returns by using a planning trick. We plan for the worst – we assume we will face the MOST HORRIBLE sequence of future stock and bond returns. We use a Retirement Withdrawal Calculator (RWC) that shows how a portfolio fares over time for a given spending rate.
• We set our target number of years.
• We make a choice for our mix of stocks and bonds. (All RWCs require this as an input.)
• The best RWC I find I find – FIRECalc – requires us to decide on our Investing Cost, and this turns out to be a very important decision. Investing Cost is the expense ratio for the funds and securities we own and advisor fees we pay each year. (See Chapter 6, NEC.) Those costs are generally expressed as a percentage of our total portfolio and, in essence, are subtracted from market returns each year. They’re a real drag.
• Then the RWC (basically) spits out the spending rate that gives us ZERO CHANCE OF DEPLETING for our target years using the MOST HORRIBLE sequence of returns it constructs. (See Chapter 2, NEC.) We make that rate our official Safe Spending Rate (SSR%).
With those three decisions you eliminated all uncertainty that result in fewer years that the target you set. At the start of our plan Patti and I had ZERO risk of not being able to take a full withdrawal for spending to my age 90.
You also get a bonus feature with FIRECalc: you see complete range of portfolio values for all the sequences it builds, and it gives your ending portfolio balance if you rode the expected sequence of return. If your investing cost is not too high, that result is always more than you started with!
== What’s MOST HORRIBLE look like? ==
I am not one to trust someone else – FIRECalc – to show me a result for something as important as my financial retirement plan without understanding the details. I wouldnt be eliminate the uncertainty of market returns if I did not trust FIRECalc’s choice of the MOST HORRIBLE sequence of return.
FIRECalc constructs sequences of returns we may face by using the historical record of stock and bond returns in the order that they occurred. I can easily find the data sources it uses on stock and bond returns. I can construct the same math it does to show how long a portfolio lasts to verify its accuracy (I did that here.) And I can see details of the worst sequences of return. (You see examples here and here.) Wow, they look really bad to me. Our brains forget how bad it’s been at times in the past. I conclude the worst sequences are breathtakingly bad. They are so bad that I conclude I don’t have to construct hypothetical, worse sequences for my planning. I’m comfortable that my plan truly uses a MOST HORRIBLE sequence of returns.
== Answers I give ==
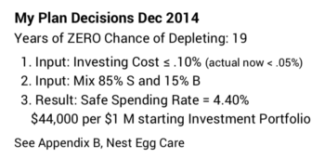
It’s the hockey stick. It’s the hockey stick. My image of our plan is a hockey stick. The shaft of the stick is the number of years of zero chance of depleting my portfolio. That was 19 at the start of our plan about five years ago. I’ve LOCKED in that point. The only thing that could make it fewer years is worse than MOST HORRIBLE returns, and I’m sure that’s basically impossible. (Patti and I could screw up and exceed our Safe Spending Amount or increase Investing Cost, but we’re sure not going to do those things.) The blade angle is the rising chances of depleting in later years. The first year I have a chance of depleting is so far away that odds, unfortunately, do not favor that either Patti or I are alive then.

Someone may ask about my mix of stocks and bonds. I tell them my mix is 85% stocks. They typically say, “Whoa. That seems really risky.” I immediately know they don’t have the image of a hockey stick in their head. We’re not going to connect on this point.
My answer is, “The amount I spend each year gives me zero chance of depleting my portfolio to at least age 90. It’s only about 15% probable that I’ll be alive then. Do you think my choice of age 90 is too risky?” They generally have no response or mumble some kind agreement that 90 is Okay. But I know their brain is stuck on the view of one-year decline as their model of risk while my brain sees my hockey stick.
== Why 85% and not 65%? ==
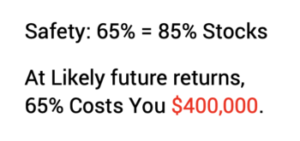
If you decide your Safe Spending Rate based on a portfolio of 85% stocks, switching then to a mix of 65% buys you NOTHING. You already have ZERO chance of depleting, and you can’t get below ZERO chance of depleting.
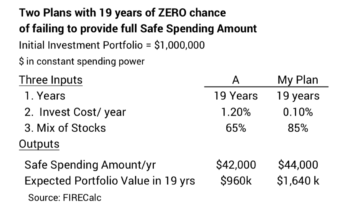
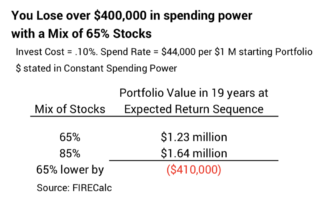
But a lower mix of costs can cost you. We’re ALWAYS better off with a greater mix of stocks when the sequence of returns we face is not MOST HORRIBLE. We’ll have much more in our portfolio. That means we have more chances to Recalculate to a greater Safe Spending Amount (See Chapter 9, NEC). Or if we never changed our annual spending amount, we’d accumulate far more for our heirs. Patti and I could accumulate $400,000 more per starting $1 million Investment Portfolio.
Conclusion. A financial retirement plan with 65% mix of stocks is not inherently safer than one with an 85% mix of stocks. With Nest Egg Care you make the three key decisions that LOCK IN the number of years you know your portfolio will give you a Safe Spending Amount. That’s ZERO risk in my view.
Your plan should start with the input of 85% stocks. You don’t gain lower risk if you then have second thoughts and move to a lower mix of stocks. You can’t go below ZERO risk. The lower mix just means you will accumulate far less if the future sequence of stock and bond returns is close to expected returns.
You plan looks like a hockey stick. Few have this image in their head. Most everyone will look at you strangely when you tell them your plan has 85% stocks. You may have doubts. If so, start out at a lower mix, say 75%. Stick with it for a couple of years. Get comfortable with your plan and your Safe Spending Amount. Then move up to a greater mix of stocks.