How do Retirement Withdrawal Calculators work? What can they tell you?
Posted on October 20, 2017

We use a Retirement Withdrawal Calculator (RWC) to help us find our Safe Spending Rate (SSR%), and the calculator also tells us, in effect, How To Invest to be confident in that Safe Spending Rate.
The key information we get from an RWC is the understanding of the most HORRIBLE sequence of financial returns we may face in the future. We then always plan for the worst and adjust if it isn’t the worst. Planning for the worst market returns essentially eliminates the uncertainty of market returns: they can’t be worse; only better. The focus on most HORRIBLE allows us to decide how much to spend and how to invest to lock in as many years of zero probability of depleting our portfolio as we want. We can then squarely face the last uncertainty that we cannot control – lifespan.
You can find a good description of how “the right kind” of Retirement Withdrawal Calculators work in Chapter 2 of Nest Egg Care. (There’s a slew of the wrong kind of calculator.) The book uses two RWCs, and I consider them as two different “brands” of calculators. FIRECalc and Vanguard calculators have good descriptions of how they work on their home or other pages. But here’s another description.
All* RWCs are based on “The Road”. The Road is 91 years of annual stock and bond returns from 1926 through 2016. That’s the period of the most detailed, accurate record of returns. There have been ups and downs along that road and even long periods of up and of down. Over that complete period, the real return rate for stocks is about 6.4% per year and 2.6% for bonds. The Road gets longer each year; it will be 92 years long at the end of 2017.
RWCs build Road Segments. RWCs use annual returns of The Road to build a bunch of Road Segments in any length you choose. Since year-by-year returns have varied, the sequence of annual returns for each Road Segment will be different. Some segments will average close to the long-term return averages, but others will average far worse and others far better.
In the book I use the example of Road Segments 23 years in length. One brand of RWC uses the annual returns to build a set of tens of Road Segments for this length and another uses annual returns in a way that results in a complete set of more than trillions and trillions of Road Segments. (Really!) (It’s so many that even with the speed of computers it has to use a sample to represent the total segments it could build.) You can ignore those differences in technique. RWCs fairly assemble the complete range of road segments we might face.*** We get to the same understanding for our financial retirement plan with both RWCs.
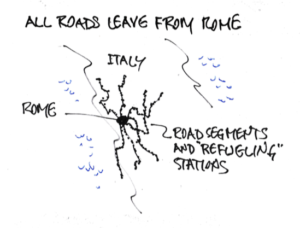
All Road Segments lead from a starting point, and we don’t know the segment we will ride on. We’d like to think that we could start our retirement journey, pick a road and travel to where we want to go. It doesn’t work that way. We don’t get to pick our road and therefore pick our sequence of future annual returns. All we know is that we’ll ride along a road that is very, very similar to one the RWC has constructed. We can think of the complete set of of Road Segments we could ride into the future as “All Roads Leave from Rome” in all different directions rather than “All Roads Lead to Rome”: some treacherous; some with average ups and downs; some smooth sailing almost every year.

Road Segments from a specific starting location are based on a mix of stocks and bonds.** We could think about stocks as black and bonds as white, so the set of Road Segments could be any tone of grey. We could think of all the roads leading from Rome as charcoal grey (75% stocks). Other locations have roads of a different tone. For example, after we’ve understood Rome, we can go to Paris where the roads are lighter grey or Vienna where their roads are darker grey to understand the impact of lesser or greater mix of stocks.

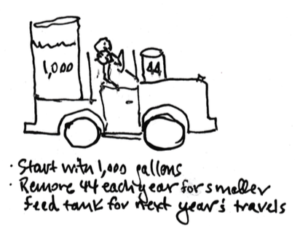
We fill up our tank, set a fuel consumption rate, and start on our journey. The fuel in our main tank is the amount we’ve accumulated throughout the years for the start of our journey. Nest Egg Care uses the example, in essence, of a starting tank of 1,000 gallons. It uses the example of a fuel consumption rate of 44 gallons per year (4.40% consumption or spending rate).

RWCs report the fuel level in our main tank as if we rode each and every Road Segment it constructed. An easy way for me to understand the year-by-year calculation of fuel level in our main tank is to envision that we start on one Road Segment and at the end of each year we pull into an unusual kind of refueling station. During the year we’ve consumed 44 gallons of fuel, and our unusual refueling station either adds more fuel (Yay!) or takes fuel out of our main tank (Ugh.). The percentage of fuel added or subtracted is based on the annual return rate for that year we just traveled.
A few RWCs also remove fuel for a cost we investors incur year after year – our investing cost. Our net investing cost is a subtraction from our fuel tank and is expressed as a percentage of the fuel in our main tank. A mutual fund’s Expense Ratio is an example of an investing cost. Advisor fees, if any, are another example.
Each year an RWC records the amount in your main fuel tank right before you’re ready to remove the 44 gallons for your small feed tank for your travels in the upcoming year. We can then graph the year-by-year fuel levels in the main tank for each Road Segment you might travel. Graph 2-4 in the book is a plot, in essence, of the year-by-year fuel level in the main tank for a 4.40% consumption or spending rate. (That graph is for roughly 70 23-year Road Segments from Vienna. The Vanguard RWC builds so many Road Segments that they just merge into a visual blur.)
You can generate a conceptually similar graph to the one in the book now at FIRECalc.com. Just hit the submit button on the home page, and you’ll get a graph in a new window of the year-by-year fuel level for each of the Road Segments it constructed for the inputs on the home page. (That standard graph from FIRECalc is of 30-year Road Segments from Rome; the segments are based on a much longer Road [since 1871] than you really want to use for your decision-making. See Nest Egg Care for the logic on this and how to correctly use FIRECalc and Vanguard for decision-making.)
What do we want an RWC to tell us? We first want an RWC to tells us when a spending rate runs into trouble – how many years is it before we reach a point that we’ve depleted our main fuel tank such that we can’t fill our smaller feed tank for one more year of travel? That’s our primary worry-point. That one Road Segment is the most HORRIBLE one we might face, and we build our plan for spending (and other decisions) around that segment. Our planning always assumes we will ride the most HORRIBLE Road Segment in the future. Planning that way essentially takes the risk or uncetainty of market returns in our decision making. We’re always able to find the spending rate that ensures zero probability of depleting our portfolio for as many years as we want. It can’t be any worse. It can only be better.
And we want to how many Road Segments might fail the next year, and so on – the year-by-year probability of depleting our main fuel tank (our portfolio). That’s important data for the years after the many years of zero probability of depleting our portfolio.
It’s not very likely that we will ride on the single most HORRIBLE sequence of returns, and we want to know what happens when we don’t. We want the RWC to tell what our fuel level might be in any year in the future for the whole set of Road Segments we might travel if we never changed our rate. If we can increase our consumption rate over time, we have a much more more fun trip.
Our choice of readily available RWCs narrows to just a few. It’s hard to find an RWC that gives us the year-by-year probability of depleting a portfolio. It’s hard to find an RWC that tells us anything about the fuel level in our main tank for the many Road Segments we might ride. I don’t know why so few are really helpful, but that’s the way it is. That’s why Nest Egg Care focuses on the the FIRECalc and Vanguard RWCs. They tell us the most.
When we put our chosen RWCs through their paces we learn key investing rules and tactics for a safer and potentially more enjoyable trip (more spending). We vary three key inputs to set after set of Road Segments and methodically record the results. We can see the effect of different spending rates (the most obvious input we want to understand), and then for a given spending rate we can see the effect of different mixes of stocks and bonds and different investing cost. Again, we’re always looking to see what happens to safety of our plan – primarily the number of years of zero probability for depletion – and to potential portfolio value over time.
• We learn that we can lock in and control that distant point in time for first possible depletion with our decisions on spending rate, mix of stocks and bonds, and investing cost. Our decisions can take out all uncertainty about how far that point is in the future. We also learn that we can decide to move that point farther away during our journey if we want to.
• We learn that we control the potential, expected portfolio value as we travel along. (Think of expected portfolio as the value we’d have if we rode the average, not the worst, sequence of returns.) We find that some changes in those three parameters increase the safety of our plan and also increase potential portfolio value. (We love those decisions!) We find that some small tradeoffs in two parameters result in the same level of safety but far greater potential portfolio value. If we can increase portfolio value with no change to safety, that’s terrific, too.
Nest Egg Care is one thorough task master: it’s put two RWCs through their paces. Hard. You don’t have to go through the methodical steps to understand what the RWCs are telling you. Nest Egg Care has distilled the evidence. You’ll understand, and you’ll make the right decisions for your retirement financial plan.
Conclusion: If we are serious about building a proper financial retirement plan, we need to use and thoroughly understand what Retirement Withdrawal Calculators can tell us.
RWCs are a key tool that will get you to you the correct Spending Rate for the start of your journey. Rules of How to Invest become clear. You’ll understand the tactics of what you can do during your journey to be safer and safer if needed or desired. And you will know if you have more than enough in your tank for your current spending rate and therefore can increase your spending for a far more fun trip.
* Some RWCs are based on someone’s projection of a future returns that aren’t related to the past. I really don’t trust those, since I have no understanding of the assumptions. I’d argue that using historical returns is going to give us retirees the right kind of information for our decision-making.
** For this description I’ll ignore the fact that RWCs might also store returns for different segments of stocks (e.g., small cap vs. large cap) or fixed income investments (e.g., short-term bonds; long-term bonds). It turns out that that level of detail is far, far down on the list of important decisions for your financial plan.
*** Well, no one can guarantee that it’s the complete range, but those really horrible Road Segments built from history are really, really bad. You can read more about that in Nest Egg Care. We don’t really have to try to imagine that we should add in worse Road Segments to understand the future.