What are expected, real returns for stocks and bonds?
Posted on September 4, 2020
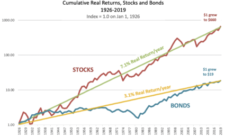
What are the real – inflation-adjusted – expected returns for stocks and bonds? Expected returns – the average annual return rates we’ve experienced over a long history – are 7.1% for stocks and 3.1% for bonds. I think these rates of return are a good guide as to what we might expect over many years in the future. The purpose of this post is to explain the update of the graph I made two years ago.

I added two more years of return data to the graph. The long-term rates for stocks and bond are the same, but the graph now corrects an incorrect label. I misstated the long-term return rate for bonds as 2.3% per year. My bad. I’ve also used that rate in several other blog posts that I’ll correct.
I like this graph. I printed this .pdf file, folded it, and glued it in the first page of Appendix C of my copy of Nest Egg Care (NEC). The display is a good visual picture of the power of compounding of returns. It also shows the periods of poor returns that we retirees hope to NEVER see: the several long periods of 0% cumulative return for both stocks and bonds and the several shorter periods of steep declines for stocks and for bonds.
The .pdf summarizes what I get out of the graph. Here is a bullet point summary.
• Expected returns. These are average, real or inflation-adjusted annual returns over a 93-year history. The graph displays the cumulative change of the real spending power of a portfolio. Annual stock returns average 7.1%. Bonds average 3.1%. Stock returns are 2.3 times that of bond returns (7.1%/2.3%).
• Compounding of annual returns amplifies the return difference. I think of the effect of compounding in terms of the number years it takes for an investment double in real spending power. Years to double follow the Rule of 72. Stocks will double in every ~ten years (72/7.1). Bonds will double in real spending power every ~23 years (72/31). I’m sticking 10 and 23 in my head now. That’s replacing the 10 and the faulty 30 (72/2.3) that I had before.
Over 93 years, $1 invested in stocks on January 1926 compounded to $660 in December 2019: that’s the effect of ~9.3 doublings (93/10): 2, 4, 8, 16, 32, 64, 128, 256, 512, and part of the way to 1028. $1 compounded to $19 for bonds: that’s the effect of ~4.1 doublings (93/23). Stocks provided 35 times the spending power of bonds.
• Returns vary. If you are younger and in the Save and Invest phase of life, you have a very long time-horizon. You can tolerate bad variations in return. When I was saving for retirement I invested solely in stocks and ignored bad variability – and at times it was REALLY BAD. $2,000 that I invested in my IRA in 1984 grew to a healthy amount to spend, in effect, this year.
We retirees are in the Spend and Invest phase of life. We focus on – maybe obsess about – the bad variations in returns that can deplete our portfolio that we rely on for our spending.
• Periods of poor returns are UGLY. Both stocks and bonds have had long periods of 0% cumulative return. Stocks have had three stretches of 0% cumulative return lasting about 15 years. Bonds had a Verrrry Looooong stretch of ~50 years of 0% cumulative return.
Within those long periods of 0% cumulative return, both stocks and bonds have declined by at least 40% in spending power in just a few years. That’s UGLY and SCARY. The three most horrible periods for stocks – greater than 40% declines – are 1930-1931, 1973-1974, and 2000-2001-2002. The most horrible period for bonds – again greater than 40% decline – was the five-year period of 1976 to 1982. This blog post has more detail on UGLY.
We retirees sure DO NOT WANT TO EXPERIENCE YEARS LIKE THOSE, but our plan must assume that we do experience them since they occurred in the past. We basically assume that we’re ALWAYS at the start of these HORRIBLE periods. This assumption drives our spending rate – the biggest lever we have to control the risk of depleting our portfolio – to a LOW, LOW level. When we find we find we aren’t riding a MOST HORRIBLE sequence of return, we adjust our plan – we can actually safely spend more. (See Recalculate in Chapter 9, NEC.) (Patti and I have recalculated to 22% real increase in our Safe Spending Amount over the past five years.)
Conclusion. I updated my graph of cumulative real returns for stocks and bonds. The expected return for stocks over the period from 1926 through 2019 is 7.1%. The expected return for bonds is 3.1%. (This is rate is correction that I displayed on my earlier graph.) The difference in returns are magnified when compounded over many years. $1 invested in stocks in 1926 grew to $660 in real spending power at the end of 2019. For bonds it’s $19. You’d have 35 times more spending power from an investment in stocks.
The graph also displays the few UGLY periods we retirees we hope we don’t experience: three ~15-year periods of 0% cumulative returns for stocks; a 50 year period of 0% return for bonds! We’ve had three two- to three-year periods when stocks declined by more than 40%, and we had one five year period when bonds declined by more than 40%.