Did you calculate to a pay increase for 2020?
Posted on December 6, 2019
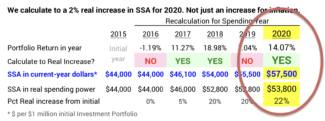
Did you calculate to a real pay increase for 2020? You should have! The returns have been that good this year. In this earlier post, I thought we were close to a real pay increase: the November stock returns of +2.5% put us over the top. This marks the third real increase in our annual Safe Spending Amount (SSA) in five years. (See Chapters 2 and 9, Nest Egg Care.) Our SSA is +22% from our start in 2015. I now know we absolutely CANNOT deplete our portfolio. We were happy with our initial SSA, and we now have lots of room to painlessly lower our spending rate to prevent that. The purpose of this post is to show and describe the highlights of our calculation for 2020.
== Real 12.3% growth in our portfolio ==
The real increase in our SSA is driven by two factors. The most important factor is the real growth in our portfolio. That was +12% return after adjusting 14% nominal return for inflation. The second contributor is the increased Safe Spending Rate (SSR%) that Patti and I can now use. The SSR% applicable to our age is a slight increase from last year: we, unfortunately, are one year closer to the end of the trail.
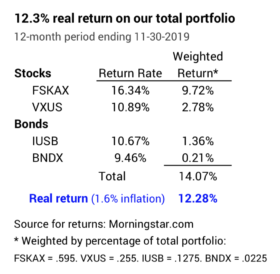
I’ve summarized key data from our calculation sheet here. Our SSA for 2020 is $57,500 as compared to $44,000 for 2015. You can print the full sheet here.
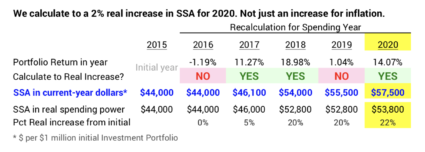
== Details of this year and last five ==
For this year, stocks returned a real 12.9% and bonds returned 8.8%. Both were well above their expected, real return rates: 7.1% for stocks and 2.3% for bonds.
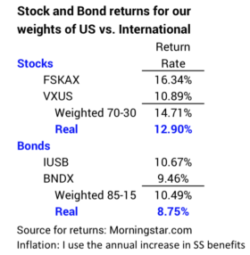
We retirees – and all investors – have tracked a sequence of returns that is better than expected since Patti and I started our plan in December 2014. The real expected return for our portfolio is about 6.4% per year – that’s based on our weights of US vs. International and our mix of stocks and bonds – and our real portfolio return has been been about .7% greater. As I mention in this post we are well ahead of our expected SSA.

== We have more now than five years ago ==
My calculation sheet tracks the real spending power of our portfolio and of withdrawals over time. The base starting point on my sheet is $1.0 million Investment Portfolio. On that basis, Patti and I withdrew $243,000 in real spending power in the first five years of our plan, and our portfolio value right before our withdrawal this year was $1.1 million. Even after the withdrawal this year for 2020 spending, we still have more than we started with. How good is that?!
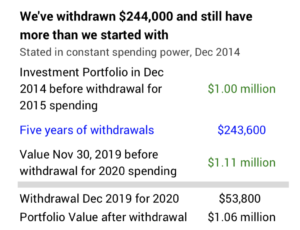
You’ve had this same experience if you followed the advice as to how to invest in NEC: your spending (and gifting) has marched sharply higher, and your portfolio value is more than when you started your plan.
== We start anew assuming the worst ==
When we recalculate to a new, higher real SSA, we step up to a higher Safe Spending Rate (SSR%). We’re actually are starting a completely new plan. I could throw away my prior calculation sheet and start a new one. (See Chapter 9, NEC.) That sheet would start with the appropriate SSR%; I’d base the start as $1 million initial Investment Portfolio; and I’d calculate a new multiplier (See Chapter 1, NEC.)
When we step up to a higher SSR% for our age, we still assume we will face the Most Horrible Sequence of returns in history. That’s the one I describe here and here. It’s HORRIBLE!
Conclusion: Patti and I – and you almost certainly – calculate to a real increase in our Safe Spending Amount for 2020. The increase is small this year, but our cumulative, real increase in our annual Safe Spending Amount is now +22% relative to the start of our plan for the 2015 spending-year. We calculate an increase primarily because our portfolio return was excellent this year – 12.3% real return. Over the past five years, the real return on our portfolio has averaged nearly 8% per year. This is well above the expected return rate for our portfolio of about 6.4% per year. You’ve had the same experience if you follow the investing advice in Nest Egg Care.