What would you do if your Safe Spending Amount increased by 50%?
Posted on August 9, 2019

How would your life change if your annual Safe Spending Amount (SSA) – your annual pay from your nest egg – increased in real spending power by 50% in the future? How would you live your life differently? Buckle up. You have to think about this, because this is what most likely will happen to your SSA: in a decade you’ll most likely be paying yourself roughly 50% more from your nest egg than at the start of your plan. Over your lifetime: double. This post explains why you will see an increase like this if future returns for stocks and bonds match their historical real returns.
== SSA is SSR% * Investment Portfolio ==
Let’s go back to the basics. Your SSA is the constant dollar amount – constant spending-power amount – that you can spend each year and confidently know you will not deplete your financial next egg. Your initial SSA is the multiplication of your Safe Spending Rate (SSR%) and your Investment Portfolio. (You subtract an off-the-top Reserve from your total portfolio to get to your Investment Portfolio for the calculations.) Your SSR% is always low because it is based on zero chance of depleting your portfolio in the face of the Most Horrible sequence of financial returns we might face. Your SSR% is a function of how many years you want for zero chance of depleting your portfolio. More years = Lower SSR%. Fewer Years = Higher SSR%. See Graph 2-7, Nest Egg Care (NEC).
== Two factors are at work ==
• Factor #1. As we age, we should accept fewer years for zero chance of depleting, and therefore a higher SSR% makes sense. Patti and I started out almost five years ago and set 19 years for zero chance of depleting our portfolio. If we stick to the same logic that got us to 19 years, we need 16 years now. In five years it will be 12 years. See Chapters 2 and 3 and Appendix G NEC.
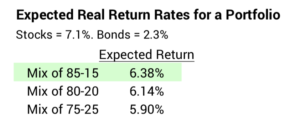
• Factor #2. Your SSA will increase at expected returns because your expected return rate exceeds your SSR% for many years. Rather than finding the median sequence of returns with its variation in annual returns to show what happens, I simply use steady real expected returns – 7.1% for stocks and 2.3% for bonds. You can see the expected real return on Patti’s and my Investment Portfolio is 6.38% per year for our 85-15 mix.
These two factors are analogous to the factors that will result in doubling of your RMD at expected returns for stocks and bonds.
== How much will SSA increase? ==
Punchline with details to follow: it most likely will at least double in your lifetime.
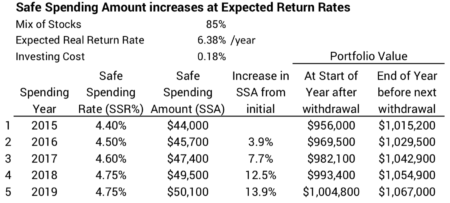
I display in this table what happens for five years at that steady 6.38% real return rate for our portfolio. I use a 4.40% SSR% – the rate Patti and I started with at the start of our plan. The table assumes a starting Investment Portfolio of $1 million. Over the five years SSA increases in real spending power by about 14%. (We’re not close to double, but just wait.) Portfolio value increases each year.
Let’s walk through two years to see how this works. Also see discussion in Chapter 9, NEC.
• Spending Year #1: 2015. In late December 2014, we withdraw $44,000 (4.40%) for spending for the upcoming year. We start January 1, 2015 with $956,000 in our Investment Portfolio.
We spend or gift all the $44,000 that we withdrew for spending. We did not save one dime. We threw nothing back into the pot. We earn the expected 6.38% that year on the $956,000 and incur the assumed Investing Cost. We have $1,015,200 at the end of the year right before our next withdrawal. That’s obviously more than the $1,000,000 we started with. That means we have more than enough to support our current SSA. We can step up to the SSR% appropriate to the fact that we are one year older: 4.50%. We withdraw 4.50% of $1,015,200: $45,700 SSA. That leaves $969,500 for the start of the next year.
• Spending Year #2: 2016. We start January 1, 2016 with $969,500. We again spend or gift all the $45,700 that we withdrew. We again earn 6.38%. We have $1,029,500 right before the next withdrawal. That again is more than we had right before the last withdrawal. We again have more than enough for our current SSA and can step up to the 4.60% SSR% due to the fact we’re another year older. We withdraw 4.60% of $1,029,500: $47,400 SSA. That leaves $982,100 for the start of the next year.
This pattern repeats. SSA increases every year or every other year. Portfolio Value only stops growing when our SSR% bumps into our 6.38% expected return. That happens for us in December 2024, Patti’s age 77 and my age 80. That does not mean our SSA declines thereafter, though.
== SSA continues to increase ==
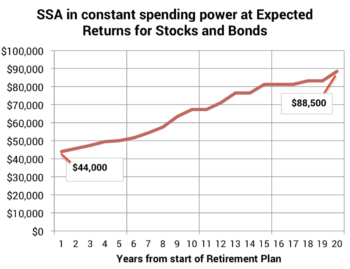
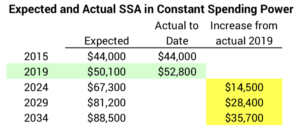
I continued the table for a total of 20 years, and I plot SSA. The graph tells me in 15 years from now – 20 years from the start of our plan – our SSA will be double the spending power we started with in 2015: start of $44,000 for spending – or gifting – in 2015 and +$88,000 spending in 2034. There’s our doubling! Both are measured in the same spending power.
== Patti and I are ahead of expected ==
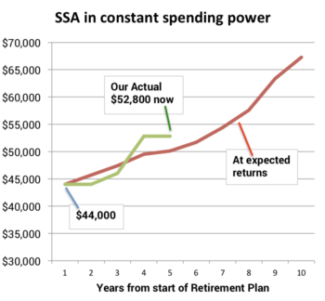
I add the plot what has really happened to our SSA given the actual ups and downs in returns so far. (You can see the details of this calculation here and here.) Patti and I are ahead of our expected SSA because of the high returns in 2016 and 2017. (You also would be ahead of your expected SSA had you started your plan before 2017.) I conclude that we may have to wait a few years before the next increase.
== Another $14,500 in just five years ==
Our SSA is $8,800 per year – times our multiplier of the assumed $1 million initial value – more than our starting amount. We could expect $14,500 more per year in five years. And another $14,000 in another five years. What a problem to have!
== What’s this mean for us? ==
Knowing that significant increases in our SSA are very likely gives me more confidence in our current SSA. We do this anyway, but Patti and I are more comfortable in fully spending (or gifting) it TOTALLY in the year.
Patti and I were very happy at $44,000 and now we pay ourselves $8,800 more in that same spending power. How will another $14,500 per year change our lives? And another $14,000 after that?
What more can we spend to Enjoy More Now? Travel is our biggest discretionary expense. We certainly are not holding back on the amount we travel, and we don’t hold back on expenses when we travel. I’d spend more on home maintenance so the house and yard looks great all the time, but that really isn’t a lot more. I honestly don’t think we can spend very much of that extra on ourselves. Much of the increases has to go to Giving to those we care about. We really like that idea. That will make us happier.
Conclusion. If you’re like Patti and me, you gear your spending to be ultra-conservative. Nest Egg Care gets us to our Safe Spending Amount assuming we face the Most Horrible sequence of financial returns. We almost certainly won’t ride a sequence like that. We need to think through what happens to our SSA when we don’t face Most Horrible. If future stock and bond returns match history, our SSA – your SSA – will increase by 50% in a decade and by 100% over our lifetimes. Patti and I are already ahead of that pace. We need to think through what that means for us: how do we think about our spending now? How will we spend – or gift – differently as our SSA increases?