How much did $2,000 in my IRA grow to over the years?
Posted on January 17, 2020

How much did $2,000 that I invested in an IRA in 1984 accumulate to in 2020? $88,200! I’ve repeated a post like this for two years now (here and here), but I always like to look back to see the power of saving, investing in stocks, and compound growth. At times I look at my IRA and ask, “Where the hell did all of that come from?” Especially after a year like 2019. The purpose of this post is just to refresh that perspective. Keep the lessons in mind for your kids and grandkids: if they save now, they, too, should have many multiples of spending power in the future.
== Our gift we opened Jan 1, 2020 ==
Patti and I conceptually opened our 36-year old gift envelope on January 1: I put $2,000 in my IRA on Jan 2, 1984 when I was 39; I invested in a stock index fund* on that date and it sat there for 36 years. It went through the ups and horrible downs in the stock market since then. But we did not touch it. Patti and I ripped open the opened the envelope this January 1 and emptied its contents on the kitchen island counter: $88,200! “Spend it all this year! We’re going to ENJOY.”
== Four envelopes ==
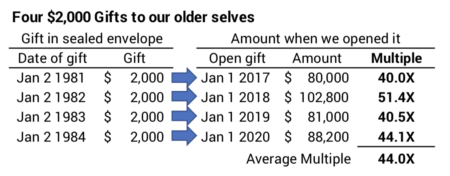
Here’s the display of four envelopes. Tax deductibility for contributions to an IRA began in 1981, so these are the first four years of today’s Traditional IRA: I display results two ways. I show in the table below the change in nominal dollars. This means dollars include the effect of inflation; we had relatively high inflation in the 1980s –6% per year from 1981 through 1984 for example. This gives a dramatic picture of the multiple we earned, but it overstates what happened in real spending power. But it sure is catchy!
The table below lets us see what really happened. I adjust the $2,000 we invested then for inflation. The $2,000 I invested in January 1984 has the same spending power as $5,050 today; that’s what I really invested to compare to the $88,200 on January 1. It’s “just” a multiple of 17.5X.
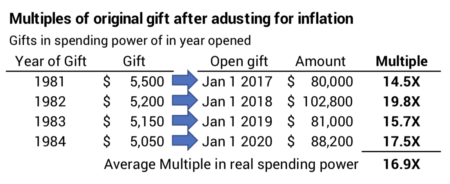
You can also see by comparing the tables that I invested $2,000 each year 1981-1984, but the inflation-adjusted amount that I invested declined each year. That’s because it took quite a few years for Congress to adjust the contribution limits for inflation. It was well past 1984 before Congress first adjusted the contribution limits. Congress’s most recent adjustment raised the contribution limit to $6,000 for 2020, and this is almost the exact same spending power as $2,000 in 1981.
== Why more than 12X in spending power? ==
My use of the Rule of 72 – using 7.1% real annual return rate for stocks – says one would expect about 12X growth in spending power in 36 years. That’s roughly half way between 8X at the 30-year mark and 16X at the 40-year mark.

The actual returns have averaged 17X. Last year’s post has a good picture of why this is true and shows that bonds would have similarly resulted in many multiples of growth: they ended their 45-year run of 0% cumulative real return starting in the early 1980s and began a steep upward climb to their current long-term average return of 2.3% per year.
== What are the lessons from this story? ==
1. To build a nest egg we have to invest heavily in stocks and tolerate their annual variability in return. Where else will we find roughly 7% real annual rate of return? Some friends of mine love bonds; some love gold; some love real estate. I just don’t get it. They can’t expect to average anywhere close 7% per year real annual return over many years.
2. Try to help the next generation understand the power of saving and investing. We all want to help make our family successful. Patti and I like the idea of giving now to help them to have more money in the future. Patti and I also want to give in a way that encourages them to be savers and investors like we were.
Conclusion: We retirees have ridden a very favorable sequence of returns starting in the early 1980s through the 1990s. Those who saved and invested are in the group of the richest retirees in history. Our savings compounded savings by many multiples by investing in either stocks or bonds. Patti and I gave $2,000 in 1984 to our older selves. We opened that gift and found 17X in greater purchasing power. $2,000 of spending power saved and invested in the year 1984 translated to roughly $3,000 per month to spend in 2020.
* Source. Morningstar. VFINX’s “Growth of 10K” graph. I change the start date to 01/02/1984 and the end date to 01/01/2020. You will see $10,000 grew to $441,300 or 44.1X.
Inflation data is from here.