How much was July’s inflation?
Posted on August 14, 2026
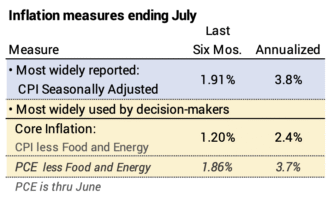
Inflation for the most widely reported measure of inflation, Seasonally-adjusted inflation, barely budged in July. Wholesale prices were flat. Core inflation, which excludes the more volatile energy and food components, increased more in the month, but the last six months and 12 months run at about 2.5% inflation. The Fed favors a different measure that runs more than one percentage point greater.
We have our first glimpse of the increase in COLA for Social Security (SS). That first reading points to 3.4% increase in benefit next year.
== Summary Table ==
I display a table and graphs that I use to follow the trends in inflation.
== SS COLA ==
I add a chart that tracks the COLA adjustment for SS. SS benefits adjusts with the average inflation increase of July, August and September for the measure CPI-W. July’s CPI-W was 3.4% greater than last July.

Details:
The two most widely-reported measures of inflation are Seasonally-adjusted inflation and Core inflation.
Seasonally-adjusted inflation is the most widely reported measure of inflation. June inflation was flat. The six-month rate is still high, 3.8%, and the 12-montn rate is 3.4%.

Core inflation excludes volatile energy and food components. July’s increase was similar to the average of the last 12 months. The six-month rate runs at 2.4% inflation, and the 12-month rate runs at 2.5%.

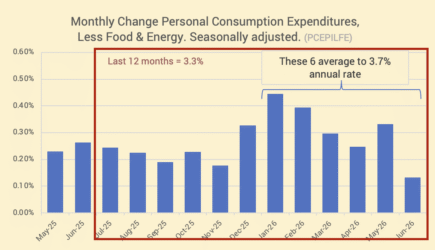
Personal Consumption Expenditures (PCE) excluding Food and Energy is the measure of inflation that the Federal Reserve Board favors. The graph shows data ending June. We get the data for July at the end of this month. The measure had been running about one percentage point greater than core inflation. It usually shows lower inflation. The last six months average 3.7% inflation and was 3.3% over the last year.
== History of 12-month inflation rate ==
Full-year inflation measured by CPI-U (not seasonally adjusted) fell to 3.3% from 3.4% last month.

== Producer’s Price Index ==
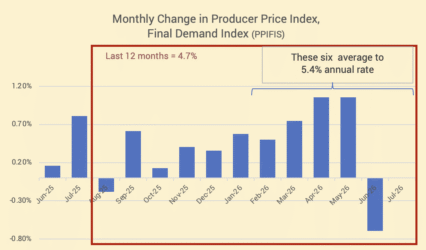
The PPI was flat in July. The last six months run at a 5.4% annual rate. The last 12 months was 4.7%.
Conclusion: Inflation data released this week showed a modest increase in inflation in July. The measure the Fed favors ran at 3.3% over the past 12 months ending June.
Our first snapshot of SS COLA points to 3.4% increase; two more monthly readings get us to the final increase.