All posts by Tom Canfield

What mid-year corrections should we make to our financial retirement plan?

Like most all of us, I look often to see how the market and my holdings are doing. (Patti has it right: she never looks!) My looks are quick: is the market up or down today? Are my holdings up or down today? I know US stocks are generally up 10% or so in 2019, but I don’t calculate how we are doing overall very often. This week I calculated our six-month return ending May 31. May 31 is our six-month mark, because I use the 12-month results ending November 30 to calculate our annual Safe Spending Amount (SSA) for the upcoming calendar year. This post shows my calculations, states what I think our return implies for the end of the year calculation, and describes my view of needed actions now. That’s easy to summarize: NONE!


== Six-month Results: 1.8% ==


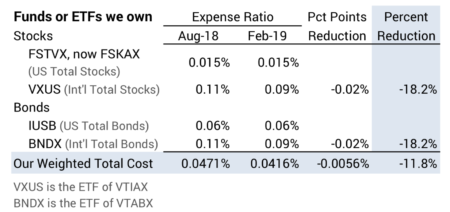
Our Investment Portfolio is up 1.8% at the six-month mark. As I describe here, I get the percentage return for each security I own using returns published by Morningstar: I only have four securities to worry about, so the calculation of the return on our total portfolio is very simple.


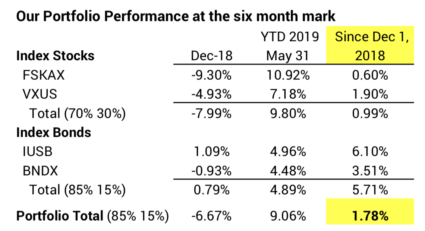
Results for YTD 2019 year are good, but I almost forget that stocks nose-dived in December. Bonds did not. As described in this post, that’s what bonds are supposed to do: when stocks crater, they don’t. We see a one-month snapshot of the insurance value of bonds at work. I won’t withdraw for spending for 2020 until early December this year, so this one-month view of bonds doing their job doesn’t mean anything. When I reach the 12-month mark on November 30 and sell securities for our spending in 2020, I may or may not see that same insurance effect at work over the whole year.


== What does that 1.8% imply? ==


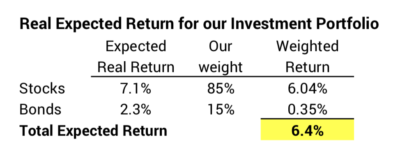
Inflation is running about 2% per year – 1% over the last six months – so my real return over the last six months is about .8%. That’s a rate that is lower than my expected real annual return of 6.4% for our portfolio. Roughly 1% real return is not great, but it’s not horrible.


The roughly 1% real return tells me that Patti and I on track for the same Safe Spending Amount (SSA) in 2020 as in 2019. We are not on track to calculate a real increase in safe spending. I’d simply adjust our current $55,500 SSA for inflation. That’s okay because that’s a 20% real increase in spending power from the start of our plan – $44,000 spending in 2015. Here’s the summary of our calculation of annual SSAs so far. You’ll find the full explanation of the calculation in Chapter 9, Nest Egg Care, and the discussion of last December’s calculation here.


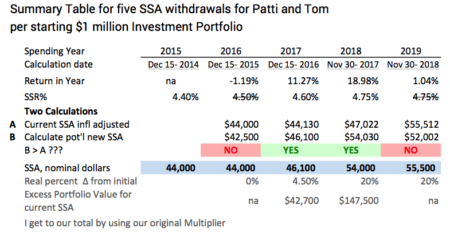
We may also be on the track for no real increase in spending for 2021. Nesteggers recalculate to a greater, real SSA when – basically – the real return on our Investment Portfolio exceeds our withdrawal rate. for example, we took out 4.6% for spending in 2017 and earned 17% real return in the year: that told me we’d have a big, real increase in our Safe Spending Amount for 2018.


Patti and I earned about -1% real return in the 12-months ending last November 30, 2018. We may be better but not my much this year. Let’s assume we earn less than 4% total real return for the two years. Our withdrawals will total about 9.5% for the two calendar years 2019 and 2020. That means we will have some catch up to do from greater returns for 2020 if we are to calculate a real increase for 2021.


== What adjustments should I make? ==


None. I have no reason to change our plan: spending rate, investing cost (already rock bottom; I really can’t get much lower), or mix of stocks vs. bonds. Our last real increase, calculated at the end of 2017, set us on a path of zero chance of depleting our portfolio through 2033.


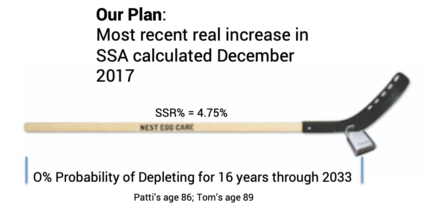
The plot of the chance of depleting our portfolio looks like a hockey stick: many years of zero chance of depleting, an inflection point, and an increasing chance of depleting in the years thereafter. We locked that inflection point with our three key plan decisions. That shaft length through 2033 is to Patti’s age 86 and my 89; I can calculate that it’s 15% probable that we’ll both be alive then.


Conclusion: Every now and then we need to take a snapshot of how our portfolio is performing in the year. Unless you use December 31 as the ending date of your calculation year, the return that you want to track is a combination of one or two months of the prior year and the return year-to-date.


The six-month return for Patti and me, ending May 31, is 1.8%. That’s not horrible, but it is tracking to a return that leads me to think I won’t be able recalculate to a greater real Safe Spending Amount (SSA) for 2020. It looks like our SSA will be the same amount in 2019; we will simply adjust the current value for inflation. Our spending amount will still be 20% greater in real spending power than in the first year of our plan.

Do you need a sandbox to play in to see if you can beat the market?

If you’re a diehard nest egger you only invest in Index funds. But some just can’t avoid the lure of trying to beat the market. Or just can’t make the switch to Index funds all at once. If you are hooked on trying to beat the market, this post recommends you open a new, tax deferred account for your Actively managed funds, ETFs or stocks and bonds. Put a small portion of your portfolio in the account. That allows you to continue to play the game of beating the market at a much more constrained level. You can clearly measure how good you really are.


== Nest Eggers and Index funds ==


Four Index funds do it for Patti and me. There’s no need to get more complex than that. The evidence tells me that over time Patti and I will be better than the 94thpercentile of investors in Actively Managed funds. We’ll beat 100% of those who pay a financial advisor on top of fund fees. That’s good enough!


== Actively Managed funds aren’t good for us ==


Actively Managed funds damage the integrity of our financial retirement plan. Our plan looks like a hockey stick and a pile of money. We’ve made the three key decisions that have LOCKED in 1) the number of years of zero probability of depleting our portfolio in the face of the Most Horrible sequence of stock and bond returns in history – the shaft of the hockey stick – and 2) the amount of money that we would have over time if returns aren’t Most Horrible.


Actively Managed funds distort the shaft of our hockey stick. We don’t know from one year to the next how they will perform relative to market returns. We’ve lost our ability to predict shaft length. That means we can’t find and trust our Safe Spending Rate (SSR%) and Safe Spending Amount (SSA). About the last thing you want to do is add more unpredictability on top of future market results.


Actively Managed funds shrink the pile of money. Their Investing Cost on average is at least four times the default cost assumed by my favorite Retirement Withdrawal Calculator (RWC). Plug in the average cost of Actively Managed funds as an input to the RWC and you can see the pile of money shrink. Big time. (See Chapter 6, NEC.)


== The lure of trying to beat the market ==


The evidence tells us we win the game, beating at least 94 percent of all investors by sticking with Index funds. Yet it’s not easy to accept Index funds. With few exceptions, the financial industry is geared to telling you that you can beat the market. And our brains fight the decision to only invest in Index funds. I describe this problem here. We’ve view ourselves as smart, competitive and successful. Even though the evidence is that we’ll be better than the 94thpercentile of investors, we just can’t accept returns that are a tiny bit less than general market returns. That just doesn’t feel right to some folks. They can’t resist the lure to try to beat the market.


== A “Sandbox” account ==


If you’re lured, I suggest you open an account in your tax deferred, retirement accounts and label it “Sandbox.” (It would take me less than five minutes to open a new account in my Retirement Accounts at Fidelity and then nickname it as “Tom’s Sandbox.” That’s what I’d see every time I logged in and looked at my Portfolio Page. I would also similarly be labeling Patti’s display of my account correctly.)


Then sell securities from another similar retirement account – you have no tax consequences for these sales – and transfer the money into the Sandbox. Make this your playpen for your experiments with Actively Managed funds, special-focus ETFs, or your choice of hot stocks if that is your cup of tea. Over time you will see how well your Sandbox account performs relative to your (in my case) “Tom’s Index Stocks” or “Tom’s Index Bonds”.


The only caveat I would recommend is to start out with a small portion of your total portfolio in your Sandbox. I’d suggest no more than 5% of your total. You may be lucky enough to be in the category of Happy Campers described in NEC, Chapter 5 with More Than Enough for their spending desires. Use some of your More Than Enough in this account. (You may have better choices as to what to do with your More Than Enough, though.)


Conclusion. We retirees should only invest in Index funds. The evidence tells us that those of us who do will be better than the 94th percentile of all investors who don’t follow that advice. We have a financial retirement plan we can count on: we’ll know our calculated Safe Spending Amount (SSA) is indeed safe. But there is a powerful lure to do better. If you cannot resist, I suggest you open an account in your Retirement Accounts that is a Sandbox for you to play in. Keep the sandbox small and measure its performance over time against you much larger holdings of Index funds for stocks and bonds.


How much more are you making from the recent decline in Investing Costs?

We all pay costs to invest. The amount we pay each year – our Investing Cost – lowers the amount we get to keep from the gross returns the market, in aggregate, provides all investors. Patti and I pay a predictable, small amount and our cost declined in February. This post examines how much less we will pay and how much more will be in our pockets. Answer: our Investing Cost dropped by 12% but that translates to just $50 per year per $1 million portfolio. A dollar a week. Small, but we’ll take it! (See Nest Egg Care (NEC), Chapter 6 for more discussion on Investing Costs.)


== Cost reduction last August ==


Last August our Investing Cost declined by 30% from about 7% of 1% of our portfolio value to about 5% of 1%. That was driven by Fidelity’s lower cost for the US Total Stocks fund that we own: FSKAX. It’s cost is 1.5% of 1%; that’s really low.*


== Cost reduction this February ==


Vanguard lowered their cost on a number of funds and ETFs by about 20% in February. This included two that we own. This translated to about a 12% total cost reduction for us.


What do we pay now? What fewer dollars do we pay? What more do we get to keep? There are a lot of decimal points to fight through for this calculation. I have to fight through calculations like this time and time again, because I don’t have the dollar amount we pay anchored in my head yet.


• I will be simplest for me if I state our Investing Costs in terms of $ per year per $1 million total portfolio. I can quickly go from that to the rough total we pay for our total portfolio. My friend Steve uses ¢ per $1,000 portfolio for his calculation; my brain does work easily with that starting point.


• It’s simplest for me to start understanding 1% of 1%. We now pay about 4% of 1%. I just have to plant 1% of 1% of $1 million in my head and then multiply by four. 1% of 1% of $1 million is $100. We pay about about $400 per year per $1 million.


How much did we save. I’ll get a headache if I start with that .0056%. Easier for me: we used to pay about $470 and now pay about $420. We pay $50 less per year per $1 million invested. $1 per week. Peanuts, but we’ll take it!


== A different look at the $50 ==


Here’s another way of looking at this: your financial retirement plan looks like a Hockey Stick and a Pile of Money. The shaft length of the stick is the number of years you’ve picked for zero probability of depleting your portfolio; that’s based on the assumption of the Most Horrible sequence of stock and bond returns in history. The Pile of Money is the amount you would have if the sequence of returns you face is not Most Horrible.


Lower Investing Cost always lengthens the shaft length of our hockey stick and always increases the Pile of Money. But $50 per year per $1 million portfolio has a very small effect on shaft length – you can count the lengthening effect in terms of days – and on the Pile of Money.


== Planting $400 in my head ==


I think I’ve done this calculation enough times that I should have the roughly $400 we pay planted in my head. But I don’t. Drawing this image is going to help with that. Go ahead. Draw one a picture like this if you have a hard time remembering your Investing Cost.


image


== What do these lower costs mean to you? ==


I bet that few retirees calculate their Investing Cost – fighting through the percentages is not easy – and then translate the percentage they pay into dollars. The financial industry just loves this: customers are in the dark as to what they pay! – even though they’ve been given the numbers to be able to figure it out. (See Chapter 6 and Appendix F in NEC and the spreadsheet in Resources on the home page to help with your calculation.)


I have friends who are paying $20,000 (2%) per year on this same basis and would have no idea that someone could pay $400. I think: “What an ugly looking hockey stick. What a puny Pile of Money. Patti and I are having a lot more fun with $19,600 per year than they are.”


Conclusion. If you are invested in Vanguard funds or ETFs, you are now paying lower Investing Cost than at the start of the year. The reduction was about 20% per fund/ETF. The weighted cost reduction for our total portfolio was about 12%. We were already low in total Investing Cost: we were paying roughly $450 per year per $1 million portfolio. The 12% reduction is about $50 per year less. We get $1 more per week! But we did no work for this. We’ll take it.


* Fidelity introduced two total market funds for their customers that have 0% Expense Ratio: FZROX and FZILX. I mentioned them here. I’m watching their net performance – net return – for investors to see if I should switch into them. Their construction – number of securities they hold, for example – do not match other total market funds, such as FSKAX or FTIHX at Fidelity or VTSAX or VTIAX at Vanguard. Other fund families have similar offerings.

Would you rent your furnace for $36 per month? I did.

I now have made two monthly payments that are, in effect, rent on our new furnace installed right at the end of last December. As I mentioned in this post, I decided not to use our financial assets to invest into non-financial assets. This post re-examines: was this the correct decision? Would you decide to rent your furnace or other capital expenditures to maintain your home? I think renting makes more sense the older Patti and I get.


I am renting in effect, because I paid for the furnace with our Home Equity Line of Credit (HELOC). We pay interest only, and I don’t ever plan on paying back the $8,000. Our monthly interest is now $36 per month.


== Years to build two kinds of Assets ==


We all have two kinds of assets: financial and non-financial. We retirees spent decades in the Save and Invest phase of life. Patti and I saved and built both financial and non-financial assets – the equity in our home; we don’t have other non-financial assets. (I don’t add in cars and furnishings in our statement of assets.) We didn’t plan on how much we should invest in financial assets vs. non-financial assets. Those investments just happened.


In our 20s and 30s. We were renters until our early 30s, so any that we saved was invested in financial assets. We both saved and invested in our taxable investment account, but we worked to get as much as we could into tax-advantaged retirement accounts starting in our early to mid 30s. That’s when IRAs and employer defined contribution retirement plans were options for us.


In our 30s, 40s, and 50s. We spent a significant amount building our biggest non-financial asset – our home. We made the down payment on our first home when I was in my mid 30s, and then we continued to invest in our home over decades when we paid our mortgage each month. Each payment decreased the principal balance of our loan and consequently increased our equity in our home. We invested when we improved our home with two air-conditioning units and duct work. (Our house was first built in 1918; for decades summers weren’t that hot here.) I’m sure we redid the kitchen twice. We added a large back deck.


In our 60s. We sharply lowered financial assets because of a big shift to non-financial. We poured financial assets into the purchase and renovation needed for our current home, the one we will live in for the rest of our lives. We put in much more than the net proceeds from the sale of our prior house into this one and the new mortgage on this home.


== Building is over ==


In our late 60s and 70s and beyond. We don’t have the outside income for Save and Invest. That phase of life is over. Now it’s Spend and Invest. The game now is to be able to safely spend (and gift) as much as is safely possible: our annual Safe Spending Amount (SSA).


In Nest Egg Care (NEC), Chapter 1 I based our retirement plan only on our financial assets and recommended you do the same. I considered our non-financial assets as a deep, deep Reserve. At the start of our plan, I thought the mix between our financial and non-financial assets was about right.


== Why add to non-financial assets now? ==


Time is not on our side. This December will be five years from the start of our plan. I use a Probability of Living Calculator and find that the expected number of years that Patti and I would both be alive will be just over eight years: 50-50 chance that we will both be alive nine summers from now! We need to FOCUS on what we both Enjoy Now. Shifting financial assets into non-financial assets doesn’t fit with that.


We’re putting stress on financial assets every time we put money into a non-financial asset. Every time we sell securities to withdraw our SSA for the upcoming years we are stressing our financial nest egg. Patti and I started our plan at 4.4% Safe Spending Rate (SSR%). Now we’re at 4.75%. When we’re in our early 80s, the SSR% that we could use will be more than the expected 6.4% real return on our portfolio (See Appendix D, NEC) . That math means our portfolio will likely decline, and that’s fine. Our life expectancies will be short – too short – then.


It’s unfair because our non-financial assets sees no stress. I find I’m continually taking money from our financial assets to spend on our home. Our home just loves this. It sits there and says to itself, “This is terrific. I’m getting a free ride here. When I need money, good old financial assets will pay 100% of what I need to keep me in style. Too bad if Patti and Tom have less to enjoy. That’s just the way it goes.”


That’s not right! Non-financial assets should carry more of their own weight – feel a little stress and not just pass it off to financial assets. Our home – our big non-financial asset – needs to cough up some cash to keep it in comfortable style.


I don’t know what’s fair to ask of our non-financial asset, but I think it should at least pay the capital costs to maintain its health or operating capacity. I’ve worked with non-profits who don’t exactly get the concept that a business has to earn enough profit (or surplus in the language of non-profits) to at least provide enough cash for capital equipment to maintain its competitive capacity. This is the same thing: non-financial needs to provide enough cash to carry it’s own weight. Here are some things that I think our non-financial asset – our home – should pay.


== The $8,000 Furnace ==


I want our home to cough up that $8,000. This conversation should not remotely come to our mind: “Oops. $8,000. We weren’t expecting to pay that. That’s a lot. Does this mean we can’t take that vacation we had planned?” That’s EXACTLY the wrong thought to have at this stage of life.


I obtained a Home Equity Line of Credit (HELOC) in 2012. The largest credit amount they would give me. It just sat there for years at a $0 loan balance. The only way Non-financial Asset can cough up cash was to have it borrow the $8,000 and transfer that to Financial Assets. That’s what I made it do.


== Am I harming heirs by this action? ==


Many retirees will think of this as lowering the ultimate value of their estate that would pass on to their heirs. I don’t think about it that way at all.


1. Our home is not going to appreciate in real value over time. Inflation distorts our understanding of this; it will be worth more paper dollars but not worth more in real terms. Our home and the money we add to the equity value of our home is going to keep its current real value over time, which means it’s going to earn 0% real return over time.


2. Compare that to the expected approximate 7% real return from financial assets. If I really thought I was harming heirs, I’d still have Non-financial Asset cough up the $8,000, decide to forego the vacation, and gift the $8,000 to our heirs. My favorite gifts are to 529 plans, their retirement accounts, and their HSA account, if applicable. All three have terrific tax benefits. I think of the Rule of 72 and think that $8,000 could be $32,000 in today’s spending power in 20 years – $64,000 in 30 years.


== Is the $36/month rent payment significant? ==


Nope. It gets lost in the other debits that hit our checking account or credit card statement. The monthly sum of these will vary by more than $36.


Conclusion: At some age – clearly the 70s for us – it makes NO sense to convert financial assets into non-financial assets. Enough with that! I drew the line this year when I made our non-financial asset – our home – cough up $8,000 that it needed for a replacement furnace. I didn’t pay for the $8,000 out of our annual Safe Spending Amount (SSA). Our Non-financial Asset borrowed the $8,000 and transferred it to our Financial Assets. This makes perfect sense to me: the $36 I have to pay each month, effectively as rent for our furnace, gets lost in the noise of other routine charges to our checking account or credit card.

Why do investors pay fund and advisor fees that make no sense?

The last post said you will be a successful investor – almost certainly better than the 94th percentile of investors over time – by investing solely in Index funds. But very few individual investors do this. This post examines why they don’t simply stick with Index funds. Basic answer: our brains are wired to make bad investing decisions.


Here’s a longer answer: folks pay high, totally unnecessary fees for three main reasons.


1. Our brains are inoculated against the evidence that simple, low cost Index funds are clearly the path to investment success. Our brains form incorrect beliefs about investing and damn the evidence that tells us those beliefs are incorrect.


2. It also takes effort – using the thinking, computational part of our brain – to understand the evidence. Worse, no one makes it easier for us to understand the evidence – what we are paying each year on our investment portfolio is an example. It takes too much work to find and process the evidence.


3. We are driven to act to control an uncertain future. We know market returns will vary. The evidence is that we retirees should set our portfolio of stocks and bonds with just a very few mutual funds or ETFs (I have four that own almost all the securities in the world.) and stick with that for the rest of our life. Our brains think that is not enough. We feel much better with a portfolio that appears more complex and sophisticated, and then we want to fiddle with it to reinforce a sense of control.


As a result, our brains are willing to pay high costs for Actively Managed funds + Financial advisors despite the evidence that it makes NO SENSE.


(I credit this book and this book for helping me understand why our brains don’t follow evidence. This is also discussed, but less clearly, here.)


== The quick logic and evidence ==


Actively Managed and Index funds must have the same returns in aggregate before consideration of Investing Costs: that’s a mathematical certainty. The difference then is that Actively Manage funds will return, in aggregate, less to their investors by the amount of greater costs they charge investors. The cost difference now is about .8% per year. (This cost difference was greater in the past, and over the last 15 years the average Actively Managed fund underperformed by 1.2% per year.)


While some Actively Managed funds in some years can overcome their cost disadvantage, we investors have no reason to base our financial plan assuming that we or anyone else can pick the funds that will outperform. We retirees, in particular, need to build a financial retirement plan based on accepting market returns (at some small cost) and not on the assumption we can beat returns.


Since stocks return about 7% real return on average that .8% difference compounds to a LOT less from Actively Managed funds than from Index funds: $10,000s if not $100,000s over time. Those who pay an advisor, say an added 1%, are really throwing money in a hole.


== Here’s my imagined internal dialog ==


1. Our human brains tell us we’re smart and above average. “I’m above average. I perform better than average in everything I’ve set my mind to. Heck, that’s why I have a nest egg now and most folks don’t. NO WAY can I settle for just targeting to just earn the average that stock and bond returns give to all investors. If I invest in Index Funds I’m guaranteed to NEVER EVER beat the market. That concept is for those average folks. NOT ME. I can do better than that.


2. Our brains tell us we can figure out what to do to control an uncertain future. “This investing game is uncertain and really important now that I’m retired. I DON’T WANT TO RUN OUT OF MONEY. Something this important requires me to figure out a solution or to hire someone who is really good at this. It just CANNOT be as simple as investing in just a few Index funds – even if they hold pieces of all the stocks and bonds in the world. That leaves me at the mercy of market ups and downs: that’s just not right! I can control the ups and downs by my investing strategy. I can smooth out annual variability for both stocks and for bonds. I need to hold a lot of mutual funds. Every year or so I need to add good funds and drop the laggards. I need to increase and decrease my investment in individual funds based on their performance. It’s complex, but I can control this tiger!


3. Our brains assign skill to those we judge to be above average. “It’s complex to figure out how to be above average in this investing game. I need help. Maybe I can develop my own method to sort out the best funds or stocks. I’ll subscribe to services that provide recommendations or provide a lot of performance data that I can sift through. I even think this is fun to do.


“Maybe I just don’t have the time for that. My skill is that I can pick out other people who are above-average performers. That confident, friendly financial advisor I’ve chosen exudes Above Average. I can tell he’s (she’s) smart. Really smart. I can tell he’s a hard worker. The company’s offices looked great to me: quality folks all around. Those monthly reports I get are full of detail. I have quite a long list of funds that I own, and I’ve never heard of many of these mutual fund companies. My guy has really researched and picked the best funds from boutique firms for me. I feel that I’m in an exclusive club. It’s amazing that my advisor is able to follow all this. He must be spending a lot of time looking out for me.”


4. Once we’ve made a decision and formed a belief, we can’t easily step back to question that decision. “I trust that I or my guy can pick winning mutual funds even though my guy didn’t really tell me he could beat the market. Now that I’ve made the decision to buy a fund or pick my guy, I know that was the correct decision. I’m sticking with these decisions. To change is to admit that I made a mistake – paying far too much over the years – and I didn’t make a mistake. Besides that, a discussion with my financial advisor about not using him in the future is too uncomfortable for me.”


5. We don’t engage the computational part of our brain to figure out what we pay. “I have no clear idea of what I’m paying the financial industry – fund plus advisor fees – in total. I can’t find a summary of what I pay on the statements I receive from my broker: I don’t see the Expense Ratio that I pay for each fund I own; I don’t find the addition of all costs I pay in a year. My financial advisor said his fees were competitive, so I think I’m getting a good deal since I know he’s better than others I’ve met.”


6. We don’t engage the computational part of our brain to see how well we are doing relative to a benchmark using Index funds. “I can tell I’m doing just fine. The market was up in 2017 by quite a bit and my portfolio also was up by quite a bit. I was down in calendar 2018, but so was just about everyone. I’m doing great so far this year. I’m not bothered that my brokerage statement does not show how I do for my mix of stocks vs. bonds and my weights of US vs. International relative to a similar portfolio that uses those average-performing Index funds. Heck, I can’t really find my mix of stocks vs. bonds and US vs. International on my brokerage statement.”


Conclusion. To make the correct decisions for our retirement financial plan, we should realize that our default process is to make decisions based on intuition and emotion. We don’t use evidence and the computational part of our brain to guide our decisions. We have a drive to act to control the future that leads us to complexity and cost in our financial retirement plan. Understand these three tendencies, I think it is easier to dig for evidence and use evidence to guide your decisions and beliefs. The evidence says to ONLY invest in Index funds for your retirement financial plan.

Why wouldn’t you decide to be in the top 6% of all investors?

I would think most retirees would be ecstatic if they knew they could be in the top 6% of all investors, and they can. But an amazing percentage of investors make decisions – or fail to make decisions – that would put them at the 94th percentile of investors. You will have $10,000s more – perhaps $100,000s more – from Index funds relative to the average Actively Managed fund. This posts restates the evidence that you can decide to be in the top 6% of investors: stick with index funds.


The post is an update to my post of about ten months ago. I summarize the information from the latest SPIVA® U.S. Scorecard for the period ending December 31, 2018. SPIVA is a report of S&P Dow Jones Indices, Inc. S&P Dow Jones produces and sells measures of stock and bond performance (indices) to investment firms who want to use them as benchmarks of performance. It publishes the Dow Jones Industrial Average® and the S&P 500® index and many more.


SPIVA is the abbreviation of S&Indices Versus Actively managed mutual funds. It compares how well Actively Managed funds perform relative to their benchmark index. SPIVA is a very thorough and objective 37-page report. Comparing performance can get tricky since poorly performing funds disappear over time (close or merge with others) and the methodology in this report accounts for the performance of non-survivors over time.


Morningstar displays the rank and performance of a fund relative to others in its category or style. But I don’t think Morningstar is accounting for the funds that no longer exist. You see this in Morningstar’s count of a much smaller set of funds in a category or style, say, 10 years ago as compared to now. When you only include today’s survivor funds in the comparison for performance over the last 10 years, you have tilted the population of funds to the surviving, more successful Active funds. That means for longer time periods Morningstar will rank an Index fund lower and rank a current, surviving Active fund higher relative to the SPIVA methodology.


== The Conclusions ==


The resulting data in this SPIVA report is almost exactly the same as in the prior report. The conclusions are the same. Bottom line: you can decide to be in the top 6% of all investors. You eventually will be at the 94thpercentile if you invest in Index Funds. If you try to to be better than the 94thpercentile, the probabilities are against you: you will wind up much worse.


1. Calendar 2018 was the ninth year in a row that a majority of actively managed funds failed to lag a broad index for the total market. In 2018 69% of actively managed funds failed to beat this index. This was the fourth worst performance since 2001.


2. Over a 15-year period, about 94% of all Actively Managed funds failed to outperform their peer benchmark index. That’s the same percentage from the report of 18 months ago. I’m still surprised that nearly 80% of all Actively Managed funds underperform their benchmark in just three years. What a bad track record!


3. On average, Actively Managed funds return about 1.2 percentage points less per year than their peer benchmark index. That’s the same deficit as in the last report. Using historical returns in this latest report, in 15 years you will have about $50,000 more from Index funds relative to each starting $100,000. You will have a lot more money if you stick with index funds.


4. Even an Actively Managed fund that performed well did not beat its peer index. An Actively Managed fund at the 75th percentile over 15 years (the breakpoint to be in top 25% of all funds) underperformed its benchmark index by about .5 percentage points per year. (I don’t show the data for this. Trust me. It’s true.)


5. The poor performance of Actively Managed US stock funds holds true for International Stocks, US Bonds and International Bonds. The worst of these is US bonds: none(!) outperform their peer index over one or three year periods, for example.


== You’ll be better than Top 6% ==


The SPIVA report shows that a single Actively Managed fund has a 6% probability of beating its benchmark index (averaging over all funds for 15 years). A typical investor won’t just own one. Let’s assume a typical investors owns four of these funds. (It’s probably many more than this.) The probability that all four will beat their benchmark index is about .001%: hold just a few Active funds and the probability of outperforming a broad market index fades dramatically. Stated differently: if you hold a broad-based Index fund, you’ll almost certainly be Much Better than the 94th percentile of all investors.


Conclusion: The two SPIVA reports I’ve looked at over the last year give the same conclusions: you can be at the 94thpercentile of investors over time by investing in Index Funds. (I argue you’ll rank much higher than this.) It’s folly to invest in Actively Managed funds: 94% fail to beat their peer index fund over a 15-year period; the average Actively Managed fund returned about 1.2 percentage points less per year. The cumulative effect is that Index funds return many $10,000s more – about 19% more. We retirees cannot afford to play our game with Actively Managed funds.

Can you Earn, Invest and Spend and NEVER pay tax? Yep: it’s an HSA account

A Health Savings Account (HSA) is about the best investment opportunity ever: it’s Triple-Tax Free. Nothing beats that. You likely accumulate +25% more after-tax dollars for spending from an HSA than from the next best thing, your retirement accounts. This post explains why – if eligible – one should try to fully contribute to an HSA. And why, for us retirees – most all of us not eligible for an HSA – this rises to very high on the list of money-gifts you may want to make to your children or grandchildren.


I used to say that you could never avoid paying income tax on the money you spend. You typically pay income tax when you earn it, and then you pay capital gains tax on the growth. Then you can spend it – and often pay sales tax on that.


A retirement account is better: you pay tax one time – when you contribute or when you withdraw for spending, but the effect is the same for either a Roth IRA or Traditional IRA (and similar plans): you do not pay tax on the accumulated growth. The table above shows that the outcome for Roth and Traditional IRAs are the same. Read here if this is not clear to you – it’s not intuitively obvious that they are basically the same.


But a Health Savings Account (HSA) beats a retirement account: growth similarly is not taxed, but you pay NO TAX when you earn or when you withdraw for eligible spending. You accumulate more to spend with an HSA. (Read here on the 7% real return for stocks and here for the math for doublings that are mentioned in the note to the table above.)


== What’s an HSA? ==


A Health Savings Account (HSA) is associated with an eligible High Deductible Health insurance Plan (HDHP). Unfortunately we retirees who receive Medicare aren’t eligible. But your children or grandchildren may have an HDHP and therefore are eligible for an HSA.


HSA-eligible plans have lower monthly premiums but high deductibles shown below for 2019. The employee pays the first medical bills up to the stated deductible. Then the health plan pays most or all costs thereafter. An employee will know if the plan they pick is HSA eligible.


A high deductible plan is more attractive to younger folks who believe they are healthy and won’t consistently be out of pocket for the deductible. Since monthly premiums are lower, they’ll pay a lot less over time if they don’t spend much of the deductible. I think Patti and I went decades with very few medical bills. I think I visited a doctor less than once a year on average up to age 45. I would have found a high deductible plan attractive, but my employer never offered one.


Many employers only offer a high deductible plan (HDHP) that is HSA-eligible to their employees. I was on the board of Propel Schools, and that’s what they offered to their employees. Propel contributed to an employee’s HSA that they sponsored – that’s not unusual – such that the annual cost to an employee would always be attractive relative to a plan with a lower deductible – the kind I was most familiar with.


== Triple NOT TAXED #1 ==


Contributions to an employer’s HSA – or to one that an employee opens independently – are NOT TAXED. The employee records the contribution as a deduction from other income. An employee can contribute $3,500 in 2019 ($7,000 Family Coverage). Contributions are not limited by higher income. (Contributions to Roth IRA are limited by higher income; the tax deduction for a contribution to a Traditional IRA is limited by higher income.)


== Triple NOT TAXED #2 ==


Growth of an investment in an HSA is NOT TAXED. This is the same as for a retirement account.


== Triple NOT TAXED #3 ==


Spending on eligible expenses is NOT TAXED. I look over the list and find that Patti and I have a significant amount of these expenses now. We’ve both had big dental expenses over the past five years, for example. I really would like to have had a triple tax-free account accumulating for the potential costs of long-term care.


== Never worse than a Traditional IRA ==


Over age 65 you can spend from an HSA for non-medical expenses – that vacation to Hawaii! – and pay tax just as if it was withdrawn from a Traditional IRA. Unlike a Traditional IRA, you are not required to make annual taxable withdrawals after age 70½. On death, what’s left in the HSA is treated like an inherited IRA.


== The investment benefit ==


An HSA is always better than a retirement account when you spend for eligible expenses. The net after tax from a retirement account is always lower than the amount from an HSA by the marginal tax rate – either when you contribute (Roth IRA) or when you withdraw (Traditional IRA). At a 22% marginal rate, you’d have 22% less in an IRA; this equates to 28% more from an HSA. You can see the power of compounding of returns. Let the amount you put into an HSA compound for many years: you put in $5,000; you have $8,800 MORE in purchasing power in 30 years from an HSA than from, e.g., a Roth IRA.


== Zero Cost! ==


The landscape of independent HSAs (and maybe company sponsored HSAs) has changed. I remember high account fees and horrible investment options when I looked at HSAs years ago. A big change came when Fidelity entered the game of independent HSA accounts just last November. You can read an opinion on this plan. See here for more detail. Here’s my snapshot of what one gets with an HSA at Fidelity. You can’t beat this:


Conclusion. We older retirees aren’t eligible for a Health Savings Account (HSA). But your son, your daughter, or a grandchild now may have a High Deductible Health Plan (HDHP) that is HSA (Health Savings Account)-eligible. An HSA is the best investment account for the future: contributions, growth and withdrawals for eligible expenses are never taxed. Nothing beats this. We should urge our children and others in our family who have an HDHP to contribute. Your gift now to their HSA is about the best financial gift you can make. That’s a 28% better gift than eventually leaving the balance of your IRA to them.

Is your checkbook Neat or Sloppy?

I guess I would judge mine as both Neat and Sloppy. I think it’s always been both Neat and Sloppy. But what’s Neat and what’s Sloppy have switched over time. This post describes what I mean. Is your checkbook Neat and Sloppy? You actually want it to be sloppy in the same way that ours is sloppy! You’ll be happier!


== Years ago: Neat and Sloppy == 


Neat. Years ago my checkbook was Neat because I managed to never have much excess cash sitting there un-invested. Maybe Efficient is a better word than Neat. I was relentless in getting money invested as quickly as possible. I worked hard to avoid earning 0% real return on idle cash in checking. (The real return on idle cash was worse than -10% in years of high inflation in the late 1970s and early 1980s.)


I received a printed paycheck every other Friday. I went to the bank to deposit it during lunch hour. I had estimated the amount that would be excess in checking – sometimes I did not need all from my paycheck for expenses in the upcoming two weeks. I wrote a check for the excess to one of my funds at Fidelity and mailed it that same day. Fidelity cashed the check and invested the proceeds on the following Monday or Tuesday.


Did this make sense? Well, if that meant I had an extra $1,000 invested for one year, say in the early 1980s, and kept it invested, that $1,000 would have compounded to a healthy multiple: you can see the example of a +40X multiple here.


Sloppy. My recording of checks that we wrote and reconciling our checkbook with the bank statement was sloppy. I’d forget to record a check; Patti might fail to tell me about a check she wrote; I’d make errors in recording the amount of a check; I’d add or subtract incorrectly. The end-of-month reconciliation drove me CRAZY. I got very lax, and I think I’d go months without a detailed reconciliation. That caused more pain later in the year. Sloppy, sloppy, sloppy.


== Now: Neat and Sloppy ==


Neat. My checkbook records are VERY Neat now. Two things make my records meticulous. 


#1. I don’t remember when I bought our first PC, but I started using Quicken shortly thereafter. My current records in Quicken stretch back to before 2000. I’ve entered every check and balanced our accounts every month for years now. 


Quicken automates recording of deposits and bills. I have 43 Scheduled Transactions that enter automatically; they repeat either monthly, quarterly or annually. (Twelve are for quarterly estimated taxes: Fed, State and City.) Some have the same dollar amount for each entry in a year (e.g., Tom’s SS Deposit). I have to enter the dollar amount for some each time (e.g., electric bill; annual home owners insurance). 


I have a very simple chart of accounts. I code major expenses (e.g., health insurance; medical expenses) and expenses on our credit card (e.g., Donation, Travel/Vacation) so I know potentially tax-deductible expenses and other expenses. I can easily run a report and add up what we spend on the Basics and what we spend on Fun, Family, and Community.


#2. Online banking has made bill payment and maintaining an accurate checkbook so much easier. I really like PNC’s online banking and its mobile app


I’ve allowed vendors to debit our checking account for all our routine bills (e.g., utilities, insurances, MasterCard). I use online banking to enter the checks that PNC will print, put in an envelope, add postage, and mail. I have about 20 routine or past vendors stored in Bill-Pay. I’m shooting to write fewer than 20 handwritten checks that I have to mail this year. I’ve handwritten six so far this year. 


Online banking lets me set alerts. I’ve set it to email me when our three paychecks have been deposited: Social Security for each of us and the monthly transfer from our Fidelity investment account. I made pncalerts@pnc.com a VIP on my iPhone so I get a notification on my lock screen when the email arrives telling me those have been deposited. I get a little shot of happiness when I look at the message on my screen telling me that money is rolling in. (I don’t want to know when someone is taking money from our account: no alerts for that!)


I’m sure I spend more time with Quicken and online banking than I did years ago, but now it’s short bursts of time. I might spend a few minutes to make sure I have entered the correct amounts for recent bills and deposits into Quicken or to enter a payment to a vendor who does not debit our account. Reconciling my Quicken record to the bank statement takes less than ten minutes.


Sloppy. I carry an average checkbook balance that would have driven me wild ten or more years ago. I auto-transfer our annual Safe Spending Amount as a paycheck, in essence, from our investment account at Fidelity. I’ve timed that payday to ensure that I ALWAYS have enough to fully paying our credit card bill.


How large is our monthly balance? Large. I can see this three ways. One way is to go online and look at the stated average monthly balance for each statement. Right on the first page I see “Average Collected Balance for APYE” – that’s the amount PNC will use to calculate the interest they will pay. As I click through the statements in 2018, I see the average balance never fell below than one month of pay as a reserve.


I can also click on tab for “Daily Balance Detail” for any month and find the low spots in a year: I had three low spots (April, May and June) in 2018 that lasted no more than a few days each, and they really weren’t that low. The staggered timing of our paydays throughout the month wiped out these low spots. (It’s also low at the end of December – as planned – when I spend or gift the last of our SSA for the calendar year.) 


The final way is to look at the interest I earned on my checking account for 2018. PNC pays .01% interest on my checkbook balance (Wowee!). For all of 2018, I earned more than $1 of interest, meaning my average daily balance was in excess of $10,000.


.0001 times


== Rationalizing my Sloppiness ==


I can look at my sloppiness of a high checkbook balance in the context of my complete investment plan. My game to maximize future returns for Patti and me – obviously with the constraint of never spending more than our calculated Safe Spending Amount – is based on two decisions: 1) our decision for our mix of stocks and bonds – 85% stocks and 2) our rock-bottom investing cost – less than .05%. Years ago I would have had a high mix of stocks, but I had more than 150X greater investing cost. (That was a mistake!) I now give up $tens per month earning potential from our high checkbook balance, but I gain $hundreds from the lower investing cost.


The other way to look at it is that I’m happy to give $tens per month because a large balance in our checking orients my brain correctly. I like the pressure it places on us: “You and Patti have plenty just sitting in checking to spend to enjoy. Remember: you don’t have an infinite amount of time to enjoy it. Figure out what you are going to do to Enjoy and do it NOW


Conclusion: My view of what’s efficient and effective in managing our money has changed over time. Patti and I carry a much larger balance in our checking account than I would have tolerated years ago. If I view that as part of our whole investment plan, it’s a small inefficiency from essentially no return relative to the big efficiency we’ve gained from dramatically lower Investing Cost. I like the pressure from a high balance in our checking account: it forces us to think how we are going to best spend it for Fun, Family, and Community.

Do you properly pay yourself in retirement? Most don’t.

If we are to truly enjoy our retirement, we must properly pay ourselves from our nest egg. We first need to pay the right amount each year – our annual Safe Spending Amount (SSA). (See Chapter 2, Nest Egg Care (NEC); see here for the current SSA for Patti and me.) Second, we need to pay ourselves in a way that makes it easier to enjoy that money. The purpose of this post is to help you think about the process of paying yourself (or yourselves).


This post is an expanded discussion of Chapter 13 in NEC. I also discussed this topic in last week’s post. I credit this book, Dollars and Sense, Chapters 5 and 6, for clarifying my thinking on this topic. Here’s the concept:


• You will be happier – enjoy your money more – if you separate the time you pay for something from when you consume it. It is uncomfortable and painful when payment coincides with consumption – you are less happy with pay-as-you-go. You have two ways to do be happier.


1. Pay in advance. That’s a big, difficult and not enjoyable decision  – but once you’ve made that purchase decision you then are happier when you consume what you’ve already paid for: that consumption will seem to be a bargain.


2. Pay for something after you’ve consumed it. You are happier when you purchase something with a credit card, as an example, and wait – up to almost two months! – before you have to pay for it.


== Step 1 ==

Get cash to spend – your SSA


Selling securities to get the cash that we can spend throughout the year is the biggest decision we retirees make each year. Calculating our SSA is one thing. Actually selling securities to get it into cash to spend is another. We worked decades to build our nest egg. It’s invested to put us in the top 6% of all investors over time. When I sell I obviously know we’re depleting it; the Rule of 72 tells me I will have a lot more in the future if I don’t sell. At the same time I sell, I’m figuring out the taxes and paying them: more discomfort.


Two things help me with this decision. First, I think of this as buying a really nice prepaid gift card for two really nice people – Patti and me. They’ve earned that amount I calculate that’s safe to pay them, and there’s no reason I why I would sell less securities than their SSA and pay them less. It’s a big gift amount, but I think of how much fun the two of them can have with that total amount. Nice folks.


Second, I couple selling for our SSA with the task the IRS makes me do: sell securities to fulfill our RMD. (Patti and I are both over 70½.) That’s a painful task, since I know the taxes on those sales will be high, netting us less than the other sales we’ll need to get to our total SSA. (All we nest eggers will find that our SSA is always greater than our RMD(s), and therefore we always must sell more than our RMD.) The task of selling more isn’t that much more daunting. It adds a small amount of added time and effort to figure out what’s best to sell for lowest taxes.


== Step 2 ==

Auto-transfer your SSA to checking 


I now disburse our total SSA – net of taxes withheld. I issue a monthly paycheck, in effect, as an automatic, direct-wire transfer from our Fidelity investment account into our PNC checking account.


I want to keep our checkbook balance healthy throughout the year. I never want to put myself in a position of having to go back to get more cash because the balance in our checkbook has gotten too low. I make the equivalent of two payments in January – 2/13ths of the total for the year. I recommended here that Margie make the equivalent of four payments (4/15ths) to herself in January.


== An alternative ==


My friend Bill completes these two steps – selling securities and issuing paychecks to his checking account – differently than I do. Bill calculates his SSA for the upcoming calendar year in December and sells just enough securities then for the taxes that he will withhold and pay in Q4. He divides the net by 12. He then automatically sells each month a portion from stock funds and bond funds he designates. Then he transfers the proceeds to his checking account.


You can see how Fidelity, as an example, let’s you implement the process in my mock-up of their Automatic Withdrawal page. My withdrawal is always from money market.


My once-a-year process to get the total cash our SSA for the upcoming years lets me be pretty precise in selling to minimize taxes – I sell higher cost shares from a mutual fund, for example. Bill’s process can’t designate shares to sell within a fund, but – averaging over many years – Bill will earn more on his SSA during the year than I will. Bill will earn the average return for his mix of stocks and bonds, while I will earn money market rates. I don’t like thinking about how the monthly variability of the market affects the value of what I’m selling that month; I’m happy to forgo the opportunity to earn more.


== Step 3 ==

Automate payments from Checking


I further disconnect the effort of payment from consumption. I let as many vendors as possible debit our checking account for their monthly charges for what we’ve consumed in the prior month. Payment is frictionless. Ten vendors debit our checking account: heat, light, water, internet and cable, cell phone, car and home insurance, health insurance and three others. l always have plenty of cash in the checking account for these. I don’t give them a thought.


I store payment information about 30 other vendors that I’ve paid over the years in PNC’s Bill Pay, and I only pay them through Bill Pay. Every time I use Bill Pay I feel good about giving PNC the cost and pain of printing checks, putting them into envelopes, adding postage, and going to the post box to mail them. PNC does all that work at no cost to me. I write fewer than 20 hand-written or computer printed checks in the year.


== Step 4 ==

Post-pay your largest expense


Our credit card is by far our largest monthly payment. In some months it’s more than all other expenses combined. When we use our credit card, we’re consuming but paying much later. We’re happier about what we consume.


I also have MasterCard debit our checking account on the date payment is due. For our current bill, MasterCard will debit our checking account at the end of April; the first charge on that statement was at the end of February. On average, we pay 28 days after we consume.


I picked the pay-day for the direct deposit from Fidelity as two days before MasterCard hits our checking for payment. I know I’ll easily have more than MasterCard will take. I have zero stress about incurring the pain of a Late Fee and the horror of 15.5% APR of accumulated interest on two months of purchases.


Conclusion: It’s all about what makes us happier. Behavioral finance tells us we’re happier – enjoy our money more – when we separate payment from consumption. 1) Pay in Advance: sell securities for the cash you need for spending well ahead of consumption; disburse cash to your checking account – your paycheck from your nest egg – well ahead of your needs to spend. 2) Pay Much Later: use your credit card. Lots. 


We also are happier when we reduce the friction or effort of paying: have your routine monthly payments (heat, light, phone, etc.) automatically debited from your checking account. The payment I’m most concerned about is the debit at the end of each month to fully pay our credit card balance; I’ve set our pay-day for the direct transfer from our investment account to be a few days before that date.


Do you think of your annual pay from your nest egg as “use it or lose it?”

A couple of weeks ago I mentioned this book, Dollars and Sense. I liked its thinking in Chapter 6. That chapter says that we are happier if we disconnect what we are buying from the action of actually paying for it. “We feel better [are happier] consuming anything that we have already paid for.” The authors’ example is of two couples that go on a vacation at a resort.


• One pays the all-inclusive price before the vacation. They ignore the posted prices for food, drink, and activities. Every day the simple thought is, “What’s the next fun thing to do today.” Whatever it is they want to do, they just do it.


• The other couple decides on pay-as-you-go. Multiple times each day they have to think about whether or not a specific item or activity is worth its price; they have to sign for each item or activity. At the end of the vacation they review the long list of charges, argue to correct a few, and then they have to pay. These folks have injected much more pain into the process of deciding what to spend and the process of spending. They are far less happy about their vacation.


We nest eggers are fundamentally happier than most retirees because we can view, in essence, our whole retirement as one big, prepaid vacation.


• We clearly understand the total we have at the start of our plan; we know we’ve invested it in a way that ensures we’ll be in the top six percent of all investors over time.


• We’ve decided what’s safe to spend each year. (See Parts 1 and 2, Nest Egg Care). That spending rate is set so we know we will never run out of money. We know our annual amount will never decline and will most likely increase. (Patti and I have increased by 20% over the last four years.)


• We put our Safe Spending Amount into cash and pay ourselves throughout the year so that we are free from worrying about small expenditures. We have “What’s the next fund thing to do?” foremost in our mind.


The purpose of this post is to explain my thinking of retirement as a prepaid vacation.


== We’re on an extensive cruise ==


We can view our whole retirement as an extensive, all-inclusive cruise. I’m going to say that we’re on The Nest Egg Care Cruise Line (The NEC Line). We step off land and join the cruise at the start of our retirement. This cruise truly is a once in a lifetime experience.


The NEC Line has a guide or manual (the Nest Egg Care workbook) that helps us divide the total pot of money we have at the start of the cruise into an appropriate annual amount (our annual Safe Spending Amount; see Chapter 2, Nest Egg Care). We’re more easily able to decide where we will stay on the ship: top-deck cabin for some, middle-deck cabin for others, and so forth.


Our annual amount includes a complete package for those Basics and for an associated package for Fun, Family, and Community (FFC). The list of Fun activities is so long and far-ranging that we have to spend time picking what it is that we would enjoy the most.


== Cruise Currency and our Debit Card ==


We have travelers from different countries on our ship. The ship doesn’t want to process spending in different currencies. It converts our dollars to units of Cruise Currency, for example. Social Security or other income is also converted to Cruise Currency. That’s what we spend on this ship, and it’s also good for all our spending in ports of call.


The NEC line subtracts our spending for the Basics each month and then issues the monthly balance for Fun, Family, and Community as a prepaid debit card. The NEC Line posts 4/15ths of the annual total in January and 1/15th in all other months for all passengers. We may have to do some juggling on timing of spending. We may spend more in a month to pay in advance for travel for a side trip at an upcoming port of call, for example. But since we get more than 25% of the annual total in January the balance of our account at the start of each subsequent month is always high.


When we want to do something fun, we just present the debit card. We never have to sign. Our Line doesn’t post the daily totals for our spending. We get the total amount we’ve spent on FFC for the month on the date than our new amount of Cruise Currency is added to our debit card. We get an electronic statement and can review the spending detail, but passengers find that using the card ensures our spending is accurate. We almost always see more added for FFC to our account than is subtracted.


The rule at NEC is that you DON’T get to keep any unspent Cruise Currency that’s available at the end of the year! You have to spend (or gift) it all in the year. Any left on December 31 is GONE.


This is quite a shift in thinking for new passengers. For years they’ve been in the mode to “Save, Save, and Invest for the Future”. They suppressed spending for Fun to have more in the future. Now’s the time to cash in: it’s “Spend (and gift) for More Fun NOW”: saving now doesn’t really result in more to spend on FFC later.


Passengers get used to this change in time. At the start of every year they enthusiastically discuss their plans to ENJOY NOW with their family and other passengers. Most spend for Fun to their heart’s content – within reason, obviously – for the first nine or so months of the year.


Then they shift to figure what might be available to gift to their family or to favored charities before the end of the year. Passengers report in customer satisfaction surveys that this is a most satisfying aspect of the NEC Line. (Cruise Currency for family and charities – landlubbers – is converted back to their currency.)


== Margie misses two keys ==


I keep thinking about Margie in last week’s post. This still bugs me. She has plenty of money for a fabulous cruise and lots of Fun, but she still worries about money – her spending – EVERY DAY. She’s put herself in the position to have to decide when she “needs” money; she goes through a tortuous process with her investment advisor to get money from her nest egg. She feels guilty every time she does that. This is NO WAY to spend one’s retirement.


Two key decisions would make all the difference in the world to her – dissolve the negative in her life (worry); get focused on the positive (spending for FFC). They’ll make all the difference in the world to you if you do both.


1. Figure out what’s safe to spend from her nest egg. It’s not hard to calculate this amount; I obviously know where to look to get the answer quickly (Appendix G, Nest Egg Care). (Note: this calculation assumes a lower Investing Cost than Margie incurs now.)


2. Pay herself a monthly amount– a direct transfer from her investment account to her checking account – in a pattern that means her checkbook is always – or almost always – flush with cash. I recommended 4/15th in January followed by 1/15th in all other months. That should do it.


Conclusion. We should think of our retirement as an extensive, all-expenses-paid cruise. We need to make a basic decision as to what’s safe to spend from our nest egg. The Nest Egg Care Cruise Line has a workbook that gets you to that decision. We also need to lessen the pain of spending money at this stage of life: don’t go through a thought process of whether or not you “need” money to spend: just pay out your total in the year in monthly amounts that keeps your checkbook balance healthy. Focus on what’s Fun to do. The sands of time are running.