How much do higher fees eat from expected growth of your portfolio?
Posted on July 26, 2019

Neighbors Bill and Mary, nice folks age 50, told me that they just signed on with a financial advisor. He’s going to manage $800,000 for them. He said his fee is 1%, so they conclude they are spending $8,000 per year for his advice and help. His help may be valuable to them, but I calculate that over 15 years Bill and Mary give up to nearly 30% of the expected growth of their portfolio – a total cost of nearly $450,000. By the 15th year, they are giving up the value of a Mercedes Benz SUV per year. That’s clearly not what I think they have in mind from “1%”. The purpose of this post is to explain the discrepancy between 1% and 30% and that $450,000 and the Mercedes SUV per year.
In fairness to the advisor, Bill and Mary are not confident in making financial decisions. They don’t have much knowledge about investing. It sounds complex to them. They don’t have a will, and the advisor said he would help them get that task completed. They want to decide on disability insurance. He’ll help with that.
== Total Investing Costs ==
The advisor did not mention the internal fund costs they would incur for their portfolio, the weighted Expense Ratio for all the mutual funds, ETFs and securities he would select for them. I’ll guesstimate this at .6% of the value of their portfolio, which is below the average for actively managed funds.
We have to conclude that Bill and Mary’s resulting Investing Cost of 1.6% per year with their advisor is, in essence, a direct reduction of the annual return rate that they get to keep. That’s their Investing Cost. We can not assume the actively managed funds their advisor picks will outperform the market before deduction of those fund costs and result in a lower net cost than 1.6%. The chance of a mix of actively managed funds doing that is just too darn low. That’s clear from many, many studies and the thorough one described here.
== Compare two options over 15 years ==
We need to clearly think through the two options. It isn’t a one-year comparison of cost. I’m measuring their cost as the difference in the amount they would have in a future year, not simply the annual differences in fees that they pay. This is the right way to look at it, don’t you think?
Here we go: I pick 15 years as the time period we want to look at. I assume $800,000 now and that Bill and Mary contribute $15,000 in today’s spending power to their investment account each year. Here are two options.
Option #1. Spend $10,000 now on a consultant to help them construct the will, pay the legal fees for the will, and a hire a consultant to help them sort and recommend disability insurance. ($10,000 sounds like too much to me for these tasks, but let’s go with it.) Invest the $790,000 balance themselves at low Investing Cost. Let’s use 6% of 1% or .06% as the Investing Cost for a simple portfolio in this case of just two funds that own all the stocks in the world. As reference, my Investing Cost is a shade over 4% of 1% or .04%.
Option #2. Invest the $800,000 with the advisor. I’ll assume he actually pays the legal fees for their will, but that would not be usual from my experience. Investing Cost is 1.6% per year.
I compare the growth of their portfolio for the two options. The difference between the two is their cost. I use Excel’s Future Value Calculation, but you can also see the same result in more detail on this spreadsheet.
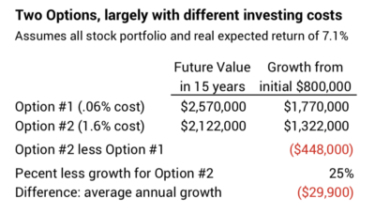
Wow! Bill and Mary start with $800,000 and the difference in the two options in 15 years is nearly $450,000. That sounds almost mathematically impossible, but it isn’t. Option #2 costs them $450,000 more than Option #1!
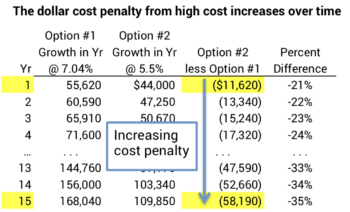
The average cost works out to be about $30,000 per year ($448,000/15 years). In the early years, the cost penalty for Option #2 is about $12,000 per year, but that grows every year eventually to about $58,000 in the 15th year. The percentage penalty in annual growth from Option #2 also increases. Both dollar penalty and percentage penalty will increase each year thereafter. On average Bill and Mary bought the equivalent of a $30,000 new car each year for their financial help: their advisor, his firm, and fund managers. In later years, they are buying them a luxury SUV every year.
== Results with different Expected Returns ==
In the example above, I used a 100% stock portfolio for Bill and Mary. I assume that 15 years is their holding period: they won’t sell any of that before they glide into their formal retirement plan somewhat after 15 years. That may be too ambitious for them. I can run this same analysis using a lower mix of stocks and greater mix of bonds.
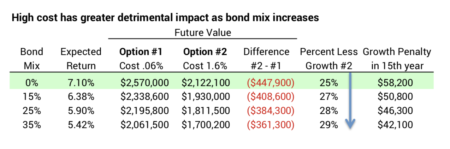
A mix of more bonds (less stocks) results in lower portfolio expected annual returns and less of a dollar difference between the two options. But this surprised me: the percentage penalty of Option #2 increases as the mix of Bonds increases. Option #2 is relatively worse for them with a greater mix of bonds. The penalty of Option #2 is 25% at a mix of 0% bonds (100% stocks). The penalty of Option #2 is nearly 30% at a mix of 35% bonds (65% stocks). That’s primarily because the advisor fee of 1% cuts much deeper – a much greater percentage reduction – into the expected return for bonds: if you have more bonds you’ll suffer a deeper cut of your total expected portfolio return.

== Will they ever know? ==
When Bill and Mary go down the path of Option #2, will they ever reach a point of understanding that their returns could be so much more? I doubt it. In our initial example of an all stock portfolio, at expected returns they would see their $800,000 portfolio and their annual additions grow to $2.1 million in 15 years. They’d feel very good about that. Will the financial reports from their advisor clearly show that their returns lag market returns or a benchmark return for their mix of stocks and bonds? They’ll never see that comparison. They’d have to do the work to understand. They’d have to do the calculations or by run a side by side experiment using low cost index funds with a portion of their portfolio.
Conclusion. Investing costs are in essence a direct reduction of your net returns in your portfolio. My Investing Costs are a low .04%. That means I get to keep about 99.4% of the expected real return on my portfolio of 85% stocks and 15% bonds (6.34%/6.38%). If I incurred investing cost of 1.6% I’d get to keep about 75% (4.78%/6.38%). When you measure the growth in portfolio value for different net returns that you keep, the difference between high cost and low cost is ENORMOUS: in 15 years an initial $800,000 portfolio invested with high Investing Cost could be $450,000 less than the same portfolio invested with low Investing Cost.