All posts by Tom Canfield

I’m an (ultra) Conservative Investor. They label me as (ultra) Aggressive.

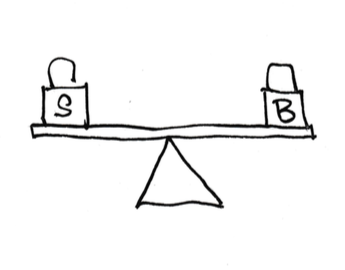
A financial plan has to consider two aspects: 1) How Much Do You Plan to Spend from Your Portfolio Year-By-Year and 2) How Do You Invest. Those two pieces of the puzzle have to fit together. You can’t judge one without the other. But if you took your plan to a financial pro (or asked him/her to start on a plan), he or she would almost certainly only consider the second puzzle piece, “How To Invest,” in officially judging if you were “Conservative” or “Aggressive”. A plan that I think is (ultra) Conservative will be judged as (ultra) Aggressive. This makes no sense to me.


Here’s my story.


My brother-in-law and his wife created a Trust about 10 years ago. I agreed to be Trustee. The Trust held option shares in his privately held company and almost no cash to invest. There wasn’t much for a Trustee to do.


They chose to create a Trust primarily to avoid future estate taxes. Maybe those shares would be worth a lot in the future. The Trust will pay for educational expenses for their children and for potential extraordinary health-related costs. But the primary beneficiaries of the Trust are grandchildren – not yet born when the Trust was formed. The Trust legally exists until the death of the last child to die. That’s perhaps 70 years in the future. That’s a really long investment horizon.


My brother-in-law’s company was sold about five years ago, and the option shares turned into REAL CASH to invest. Oops, all of a sudden, I had real work to do. I had to get that invested correctly.


I consulted with a lawyer, and I decided that I needed to hire a financial advisor, even though I thought the investment decisions were not complex. It was a CYA action to avoid any potential liability of being both Trustee and Investment Advisor to the Trust. And I needed someone to carry forward if something happened to me. (Don’t think I’ll be around for 70 more years!)


I found Mike, a very good guy and financial advisor with lots of professional initials after his name. I liked his firm and the other folks there. Mike agreed with me on investment structure for the Trust and agreed to a very reasonable fee; he knew the Trust would be a very long-term customer.


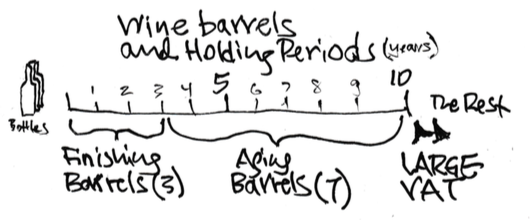
I first developed a cash flow plan that forecast year-by-year cash needs that I then put into four groups. I was somewhat conservative in my estimate of cash needs, overestimating how much I would actually need to spend each year (primarily taxes and distributions for educational expenses). I grouped my years of cash flow needs. Some people might call these groups “buckets.” I chose to use the analogy of “wine bottles and barrels” instead. Here’s the arrangement of the bottles and barrels.


Bottles: wine that is bottled from the finishing barrels each December. It’s the cash the Trust will spend in the upcoming year.


Finishing barrels (3) hold three-years of cash needs – holding periods of one through three years. (A holding period is the length of time you hold onto an investment before you sell it for spending.)


Aging barrels (7) hold cash needs for seven years – holding periods of four through ten years.


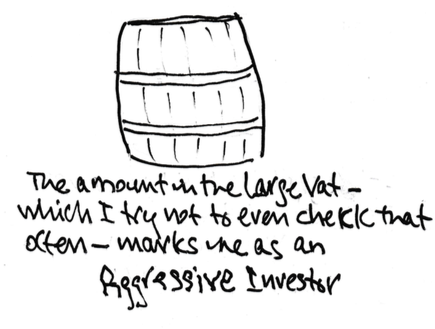
A Large Vat holds the remainder. The first drop of wine from the Vat would be consumed not before ten years.


Mike and I both agreed that the following made perfect sense in terms of investment structure. We both agreed that this was a conservative plan plan given the holding periods for the barrels.
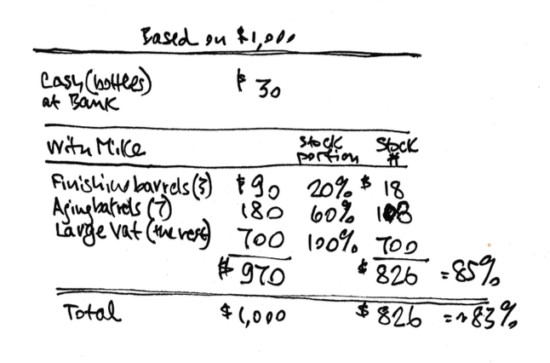
 

Bottles: cash in the Trust’s checking account


Finishing barrels in one account with Mike at 80% Bonds and 20% Stocks


Aging barrels in one account with Mike at 40% Bonds and 60% Stocks


Large Vat in one account with Mike at 100% Stocks


I next multiplied my cash forecast by the mixes for each group of wine barrels. That total multiplication added up to 85% Stocks and 15% Bonds in the accounts with Mike. Made perfect sense.


Mike and I met to sign the final paperwork to set up the account. He had one required form for me to sign that asked two questions as best as I remember:


1. What would you do if stock returns were below 0% next year? This was a multiple-choice question with answers ranging from Sell All Stocks to Do Nothing.


Of course I marked “Do Nothing.” I knew real stock returns have been below 0% about one-third of all years, so this this seemed like a strange question to me. My average holding period for the total invested is probably 30 years. It’s 100% probable that stocks will outperform bonds over that period, so I’d be foolish to sell Stocks if the return falls below 0% for one year. That seemed like a really silly question to me.


2. I then had to mark how I classified myself as an investor. The choices ranged from Conservative to Aggressive. I marked Conservative. (As Trustee, I’d be crazy to mark anything else.)


Mike said, “You can’t mark that box.”


“But, Mike, we’ve been all through this. My cash needs are really low relative to the amount of money that is there. I’ve probably overestimated my cash needs. Heck, I don’t even think I withdraw the dividends that will be earned in any year. This pool of money can only grow over time; it will never run out. I’m being conservative to overly conservative in the way I’ve forecasted cash flows and the way we’ve structured the three accounts. Don’t you agree?”


“Yep, I agree, but you have to put your checkmark in the Aggressive box. (I think he would have said Wildly Aggressive if that existed.) My compliance officer and the regulators would not permit me to have you invested in 85% stocks if you don’t check the Aggressive box.”


So, I erased my checkmark and placed it in the Aggressive box. It made no sense to me.


If I had not thought it through, I would have simply checked the Conservative box and just taken the advice from the pro. With an advisor other than Mike, I might have been convinced that 85% stocks was too Aggressive and Risky, exposing me to undesireable liability. I would have (incorrectly) lowered the mix of stocks significantly.


Why is this? The label financial folks are geared to judge a portfolio is in relation to one-year variability of returns, and for one-year periods stock return rates are more variable than for bonds (but the opposite is true for long holding periods). If I bought into that thinking, I would wind up with an investment mix that made no sense for the Trust’s long, long time horizon.


Conclusion: When we’re retired our financial plan has similar components to this story.


We have a long investment horizon. We clearly don’t have 70 years, but we typically are planning for a retirement period that may last decades.


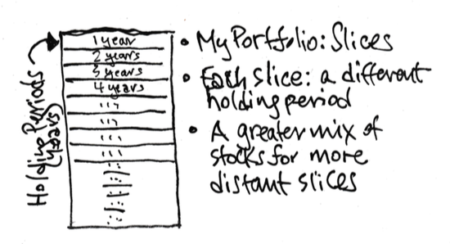
We have different investment horizons or holding periods for when we will actually sell securities from our portfolio to get cash to spend. Those holding periods will range from one year to maybe 20 years or more.


Our investment piece of the puzzle is related to our spending rate piece of the puzzle. For example, a lower spending rate means a greater portion of stocks will be in the Large Vat. That’s going to work out to a greater overall portion of stocks.


When you use Nest Egg Care to make your decisions for your financial retirement plan, I think you’ll agree that your plan for spending and for mix of stocks and bonds will shout “Conservative” to you. I definitely think of our plan that way. But that plan could very well be labeled “Aggressive” – implying you are imprudent and overly risky for an intelligent, sensible retiree. You’ll most likely have to shut your ears to those who only look at one piece of the puzzle.

Why is it important to rebalance our mix of stocks and bonds in our portfolio?

Annually rebalancing back to our chosen mix of stocks and bonds is far more important for us retirees than it is for younger folks. Rebalancing is “required” when you’re following the CORE principles in Nest Egg Care.


I think many folks who are not retired don’t rebalance their portfolio that often. Nor do they need to in my view for their retirement accounts, in particular. These folks typically have many years before they reach retirement. Their holding period – the length of time they hold an investment before they sell it to obtain cash for spending – is long, maybe 20 years or more.


I recently read the book, The The One-Page Financial Plan, by Carl Richards. I generally liked the book, but I was struck by the statement for one section of the book, “Rebalancing Is the Seventh Wonder of the Investing World.” Richards states that rebalancing your mix of stocks and bonds is “forcing yourself to take money from the thing that did well last year (sell high) and you’re moving it to the area that did less well (buy low).” There’s no further explanation of the effect. Rebalancing sounds nice, but that just doesn’t hang together for me for retirement savings.


When younger folks work through the process of rebalancing for a number of years, they’ll think, “When I rebalance, I’m usually selling stocks to buy bonds. Stocks have greater return potential than bonds. When I rebalance each year for a number of years, I think I’m just lowering my total dollar return. Why am I doing this?”


Good question! The long term real return rate for stocks is about 6.4% and it’s 2.6% for bonds; the rate for stocks is 2.5X that for bonds. (And compounding over many years expands the dollar effect.) It’s hard to argue that you want to hold bonds for long holding periods.


Let’s look at the probabilities and returns for a 20-year holding period. For that period, stocks will outperform bonds about 96% of the time. Also, the worst average annual return rate for stocks is greater than that for bonds (The worst 20-year rate is actually positive for stocks, but negative for bonds.); and over those years the effect of compounding expands the basic 2.5X return advantage.* Holding bonds for that length of time is a “bet” that is on the wrong side of the probabilities and return potential.


Yes, holding a significant portion of bonds smooths out the variability of one-year returns. But younger investors shouldn’t buy into the logic that lower one-year variability of returns is good and therefore pay for that with a low mix of stocks that comes at the expense of a whopping difference in portfolio value in the long run.


I have always had a long-term perspective in my Save and Invest phase. I viewed each annual amount I contributed to my retirement accounts as an investment packet, each with a long holding period – typically more than two decades. Therefore, each of those annual contributions had to be invested in stocks. Therefore, overall I was invested 100% in stocks; I obviously never had to rebalance my retirement portfolio. I tolerated periods of “very bad variability” in stock returns, but I rode through them. (You can read more about my results of just sticking with stocks for one year’s contribution – one investment packet – to my retirement account in a future post.)


Now that I’m retired, it’s completely different. The “game” of Spend and Invest is different from the game of Save and Invest. Once a year I’m selling securities from our nest egg to get cash for next year’s spending. In effect, I’m dissipating our nest egg; I’m not accumulating. My mindset now has to be Remain Worry Free! That’s a BIG SHIFT from the many decades of Save More to Accumulate More!


But I stick with one key view of my investments. Just as I viewed each added investment in my retirement account as an investment packet, I now view our total portfolio as a series of spending packets. Each spending packet or slice of the total has a different length of holding period. Some very short. Some very long (hopefully). I’ll consume slices in sequence. We want bonds in many of those spending packets. Why?


We want to hold more bonds for packets with short holding periods. Let’s assume I’ve just sold securities from our investment portfolio for spending over the next 12 months. (Conceptually it’s sitting in my bank checking account.)


The packet that I’ll hold until next year at this time should be almost solely bonds; at most it should have only a splash of stocks. That makes sense from understanding the probabilities and investment returns. For a one-year holding period it’s only somewhat more probable that stocks will outperform bonds. (Stocks beat bonds just 60% of the time for one-year holding periods.) The downside performance of stocks is scary: the worst one-year return for stocks is disgustingly worse (-39% real return) than the worst one-year return for bonds (-11% real return).*


As I think through the slices for future years, more stocks makes sense – the probabilities that stocks outperform bonds improves quickly; the worst performance of stocks is about equal to that of bonds;  the compounding of expected return rates makes stocks more attractive. I still want to have bonds in many slices, but at some point the slices should be 100% stocks.


I want to hold bonds, since they’ll keep my emotions in check when “bad variability’ strikes. We’ll be hit (in all probability) with “bad variability” of stock returns in the future. We build our retirement spending and investing plan by assuming we will face horrible sequences returns; that’s what drives our Safe Spending Rate (SSR%) to a low level. I know our SSR% will ensure a long life for our portfolio even in the face of horrible sequences. But when I’m hit with that first instance of “bad variability” of returns my sense of Worry Free may be shaken. The fact that I hold bonds will help. I repeat my “self-talk” speech to prepare me, “Isolate yourself from the emotional stress of ‘bad (possibly disgustingly horrible) variability’ of stock returns, even if that means your portion of bonds means lower total returns over time. You’ll be less stressed and even perhaps happy that you hold bonds in a year when stocks hit the skids and bonds don’t. You’re past the time of life when Accumulate More! was paramount. Now its paramount to Remain Worry Free! Remain Worry Free!”


The decision on mix of stocks and bonds is one of five key decisions for any retirement financial plan. As you work through Nest Egg Care, you’ll make your decision on mix of stocks and bonds from information we get from two Retirement Withdrawal Calculators (RWCs). Mix has two effects on your financial retirement plan. It has an effect on the year-by-year probability of depleting a portfolio for any given spending rate. And it has an effect on the probable value of your portfolio over time. (I’ve done my best in Nest Egg Care to help you understand the tradeoffs of these two effects; you want to engage the “slow thinking” part of your brain on this one!) Therefore, when you’ve completed your Worksheet in Nest Egg Care, your choice of mix is a “strategic” decision. You want to stick with your strategic decisions over time.


The mechanics of RWCs always assume we start each year with the same mix of stocks and bonds. Just to review, an RWC assumes a mix of stocks and bonds (We input that mix.), and the RWC starts every year assuming that design mix. That means it has rebalanced the portfolio to that design mix after it’s withdrawn the chosen constant dollar spending amount for the upcoming year. We’ve got to follow that same process. Rebalance annually.


Conclusion: We retired folks want to hold bonds in our investment portfolio, and we must rebalance our mix of stocks and bonds back to our design mix at the end of each year after we’ve taken our withdrawal for spending in the upcoming year. (Rebalancing is not as simple of a task as I initially thought. It’s much easier if you rebalance at the same time you are selling securities for your spending amount in the upcoming year. You have a spreadsheet in Resources on this site that will help you rebalance annually.)


* See Stocks for the Long Run, Chapter 6, Table 6-1 and Figure 6-1. Jeremy Siegel. Fifth Edition. 2014. McGraw Hill Education. Chapters 5 and 6 are pretty dog-eared in my copy.

How do Retirement Withdrawal Calculators work? What can they tell you?

We use a Retirement Withdrawal Calculator (RWC) to help us find our Safe Spending Rate (SSR%), and the calculator also tells us, in effect, How To Invest to be confident in that Safe Spending Rate.


The key information we get from an RWC is the understanding of the most HORRIBLE sequence of financial returns we may face in the future. We then always plan for the worst and adjust if it isn’t the worst. Planning for the worst market returns essentially eliminates the uncertainty of market returns: they can’t be worse; only better. The focus on most HORRIBLE allows us to decide how much to spend and how to invest to lock in as many years of zero probability of depleting our portfolio as we want. We can then squarely face the last uncertainty that we cannot control – lifespan.


You can find a good description of how “the right kind” of Retirement Withdrawal Calculators work in Chapter 2 of Nest Egg Care. (There’s a slew of the wrong kind of calculator.) The book uses two RWCs, and I consider them as two different “brands” of calculators. FIRECalc and Vanguard calculators have good descriptions of how they work on their home or other pages. But here’s another description.


All* RWCs are based on “The Road”. The Road is 91 years of annual stock and bond returns from 1926 through 2016. That’s the period of the most detailed, accurate record of returns. There have been ups and downs along that road and even long periods of up and of down. Over that complete period, the real return rate for stocks is about 6.4% per year and 2.6% for bonds. The Road gets longer each year; it will be 92 years long at the end of 2017.


RWCs build Road Segments. RWCs use annual  returns of The Road to build a bunch of Road Segments in any length you choose. Since year-by-year returns have varied, the sequence of annual returns for each Road Segment will be different. Some segments will average close to the long-term return averages, but others will average far worse and others far better.


In the book I use the example of Road Segments 23 years in length. One brand of RWC uses the annual returns to build a set of tens of Road Segments for this length and another uses annual returns in a way that results in a complete set of more than trillions and trillions of Road Segments. (Really!) (It’s so many that even with the speed of computers it has to use a sample to represent the total segments it could build.) You can ignore those differences in technique. RWCs fairly assemble the complete range of road segments we might face.*** We get to the same understanding for our financial retirement plan with both RWCs.


All Road Segments lead from a starting point, and we don’t know the segment we will ride on. We’d like to think that we could start our retirement journey, pick a road and travel to where we want to go. It doesn’t work that way. We don’t get to pick our road and therefore pick our sequence of future annual returns. All we know is that we’ll ride along a road that is very, very similar to one the RWC has constructed. We can think of the complete set of of Road Segments we could ride into the future as “All Roads Leave from Rome” in all different directions rather than “All Roads Lead to Rome”: some treacherous; some with average ups and downs; some smooth sailing almost every year.

Road Segments from a specific starting location are based on a mix of stocks and bonds.** We could think about stocks as black and bonds as white, so the set of Road Segments could be any tone of grey. We could think of all the roads leading from Rome as charcoal grey (75% stocks). Other locations have roads of a different tone. For example, after we’ve understood Rome, we can go to Paris where the roads are lighter grey or Vienna where their roads are darker grey to understand the impact of lesser or greater mix of stocks.

We fill up our tank, set a fuel consumption rate, and start on our journey. The fuel in our main tank is the amount we’ve accumulated throughout the years for the start of our journey. Nest Egg Care uses the example, in essence, of a starting tank of 1,000 gallons. It uses the example of a fuel consumption rate of 44 gallons per year (4.40% consumption or spending rate).


RWCs report the fuel level in our main tank as if we rode each and every Road Segment it constructed. An easy way for me to understand the year-by-year calculation of fuel level in our main tank is to envision that we start on one Road Segment and at the end of each year we pull into an unusual kind of refueling station. During the year we’ve consumed 44 gallons of fuel, and our unusual refueling station either adds more fuel (Yay!) or takes fuel out of our main tank (Ugh.). The percentage of fuel added or subtracted is based on the annual return rate for that year we just traveled.


A few RWCs also remove fuel for a cost we investors incur year after year – our investing cost. Our net investing cost is a subtraction from our fuel tank and is expressed as a percentage of the fuel in our main tank. A mutual fund’s Expense Ratio is an example of an investing cost. Advisor fees, if any, are another example.


Each year an RWC records the amount in your main fuel tank right before you’re ready to remove the 44 gallons for your small feed tank for your travels in the upcoming year. We can then graph the year-by-year fuel levels in the main tank for each Road Segment you might travel. Graph 2-4 in the book is a plot, in essence, of the year-by-year fuel level in the main tank for a 4.40% consumption or spending rate. (That graph is for roughly 70 23-year Road Segments from Vienna. The Vanguard RWC builds so many Road Segments that they just merge into a visual blur.)


You can generate a conceptually similar graph to the one in the book now at FIRECalc.com. Just hit the submit button on the home page, and you’ll get a graph in a new window of the year-by-year fuel level for each of the Road Segments it constructed for the inputs on the home page. (That standard graph from FIRECalc is of 30-year Road Segments from Rome; the segments are based on a much longer Road [since 1871] than you really want to use for your decision-making. See Nest Egg Care for the logic on this and how to correctly use FIRECalc and Vanguard for decision-making.)


What do we want an RWC to tell us? We first want an RWC to tells us when a spending rate runs into trouble – how many years is it before we reach a point that we’ve depleted our main fuel tank such that we can’t fill our smaller feed tank for one more year of travel? That’s our primary worry-point. That one Road Segment is the most HORRIBLE one we might face, and we build our plan for spending (and other decisions) around that segment. Our planning always assumes we will ride the most HORRIBLE Road Segment in the future. Planning that way essentially takes the risk or uncetainty of market returns in our decision making. We’re always able to find the spending rate that ensures zero probability of depleting our portfolio for as many years as we want. It can’t be any worse. It can only be better.


And we want to how many Road Segments might fail the next year, and so on – the year-by-year probability of depleting our main fuel tank (our portfolio). That’s important data for the years after the many years of zero probability of depleting our portfolio.


It’s not very likely that we will ride on the single most HORRIBLE sequence of returns, and we want to know what happens when we don’t. We want the RWC to tell what our fuel level might be in any year in the future for the whole set of Road Segments we might travel if we never changed our rate. If we can increase our consumption rate over time, we have a much more more fun trip.


Our choice of readily available RWCs narrows to just a few. It’s hard to find an RWC that gives us the year-by-year probability of depleting a portfolio. It’s hard to find an RWC that tells us anything about the fuel level in our main tank for the many Road Segments we might ride. I don’t know why so few are really helpful, but that’s the way it is. That’s why Nest Egg Care focuses on the the FIRECalc and Vanguard RWCs. They tell us the most.


When we put our chosen RWCs through their paces we learn key investing rules and tactics for a safer and potentially more enjoyable trip (more spending). We vary three key inputs to set after set of Road Segments and methodically record the results. We can see the effect of different spending rates (the most obvious input we want to understand), and then for a given spending rate we can see the effect of different mixes of stocks and bonds and different investing cost. Again, we’re always looking to see what happens to safety of our plan – primarily the number of years of zero probability for depletion – and to potential portfolio value over time.


We learn that we can lock in and control that distant point in time for first possible depletion with our decisions on spending rate, mix of stocks and bonds, and investing cost. Our decisions can take out all uncertainty about how far that point is in the future. We also learn that we can decide to move that point farther away during our journey if we want to.


We learn that we control the potential, expected portfolio value as we travel along. (Think of expected portfolio as the value we’d have if we rode the average, not the worst, sequence of returns.) We find that some changes in those three parameters increase the safety of our plan and also increase potential portfolio value. (We love those decisions!) We find that some small tradeoffs in two parameters result in the same level of safety but far greater potential portfolio value. If we can increase portfolio value with no change to safety, that’s terrific, too.


Nest Egg Care is one thorough task master: it’s put two RWCs through their paces. Hard. You don’t have to go through the methodical steps to understand what the RWCs are telling you. Nest Egg Care has distilled the evidence. You’ll understand, and you’ll make the right decisions for your retirement financial plan.


Conclusion: If we are serious about building a proper financial retirement plan, we need to use and thoroughly understand what Retirement Withdrawal Calculators can tell us.


RWCs are a key tool that will get you to you the correct Spending Rate for the start of your journey. Rules of How to Invest become clear. You’ll understand the tactics of what you can do during your journey to be safer and safer if needed or desired. And you will know if you have more than enough in your tank for your current spending rate and therefore can increase your spending for a far more fun trip.


* Some RWCs are based on someone’s projection of a future returns that aren’t related to the past. I really don’t trust those, since I have no understanding of the assumptions. I’d argue that using historical returns is going to give us retirees the right kind of information for our decision-making.


** For this description I’ll ignore the fact that RWCs might also store returns for different segments of stocks (e.g., small cap vs. large cap) or fixed income investments (e.g., short-term bonds; long-term bonds). It turns out that that level of detail is far, far down on the list of important decisions for your financial plan.


*** Well, no one can guarantee that it’s the complete range, but those really horrible Road Segments built from history are really, really bad. You can read more about that in Nest Egg Care. We don’t really have to try to imagine that we should add in worse Road Segments to understand the future.

Our Safe Spending Amount will at least increase by 2% for 2018.

Last week the Social Security Administration announced a 2.0% increase for inflation (COLA or Cost-of-Living Adjustment) for 2018. What’s this mean for me and for you?


1. Social Security payments will increase by 2% starting in January. That’s the increase before the deduction of spending for Medicare Part B Premiums. (The Part B Premium is a health insurance payment toward a portion of Medicare’s cost of doctor’s visits and other outpatient services.) That spending deduction will be announced later. Those of us receiving Social Security may not see a net increase of 2%.


2. Those of us who follow the CORE principles in Nest Egg Care will see an increase of our Safe Spending Amount (SSA) from our Nest Egg of at least 2%. (That’s just to maintain the same spending power in 2018 as it was in 2017.)


So far, cross our fingers, it looks like every retiree – no matter their age – will see an increase in their SSA of more than 2% if they follow the CORE principles in Nest Egg Care – a real pay increase. That’s because the 12-month return – over a wide range of Stock and Bond mixes – will be such that our portfolio will be significantly greater than it was after last year’s deduction of SSA for spending in 2017. (This could be the second year in a row that retirees – no matter their age – will have a real SSA “pay increase.”)


My friend Alice, who recalculates based on the 12-month return results ending October 31, tells me that the 12-month return rate on her portfolio – ending September 30 – is 13.8%. While she doesn’t exactly know the result for October 31, it almost certainly looks like she’ll have a greater portfolio even before her deduction of SSA for her 2017 spending last November. She’ll have “more than enough” for her current SSA.  She’ll also be applying a greater SSR% than she did last November: she’s one year older. The combination of the two effects means she should wind up with much more than a 2% increase for 2018 .

Live the Core

Nest Egg Care describes four CORE principles for your financial retirement plan. I think you will find the workbook is straightforward and simple to follow. Nest Egg Care gives you a worksheet and shows you the one I completed for our plan. The resulting plan is very simple. I’m able to compress our complete plan to a 3″ by 5″ card that I’ve tacked to the side of my computer. Here’s a short overview of the four CORE principles.


1. CHOOSE your Safe Spending Rate (SSR%). For once, it’s better to be older.


Your spending rate is a constant-dollar amount (the numerator) divided by $1 million starting portfolio (the denominator). “Constant dollar” means your spending amount retains the same purchasing power over time, adjusting similarly to the way Social Security payments adjust. The annual amount you spend is independent of variations in your portfolio value.


We use a Retirement Withdrawal Calculator (RWC) to give us key information that will lead to a Safe Spending Rate (SSR%). The correct kind of RWC to use tells us how a portfolio fares for a given spending rate over a wide range of sequences of stock and bond returns we may face. The sequences of returns RWCs build will range from the worst in history to the best. We pick our SSR% to be safe even in the face of HORRIBLE future sequences of returns.


Each spending rate has a number of years of zero probability of depleting a portfolio and then a rising probability in the years thereafter. The plot of the probabilities looks like a hockey stick: a shaft of years of zero probability of depleting a portfolio, an inflection point, and a rising blade angle thereafter. Lower spending rates have longer shaft lengths; greater spending rates have shorter shaft lengths. You’ll pick a stick (SSR%) with a long shaft length if you are younger. If you are older a shorter shaft length makes sense. As the years pass in retirement, it’s almost certain that you’ll have opportunities to play with shorter and more fun sticks (greater spending rate) than the one you initially start with.


Nest Egg Care recommends how you should pick your stick (SSR%). The planning “trick” is that we always pick a spending rate that assumes we will experience the most HORRIBLE sequence of returns that an RWC builds. By assuming the worst, we’ve eliminated “market uncertainty” or “market return risk” from our planning; returns can’t be worse; they can only be better. We are always planning for the worst, and as time passes we adjust to a greater SSR% when we find we haven’t been riding along one of the most HORRIBLE sequences. But every time we adjust, we again assume we will then face one of those most HORRIBLE sequences.


The Safe Spending Rate (SSR%) you pick will have zero probability of depleting for many years – generally two decades or more – and roughly 1-in-50 chances of your outliving and outspending your portfolio in the years thereafter. Those probabilities did not budge my or my wife’s worry meter. You’ll also learn the best steps to take during retirement if your want to or need to lower those out-year probabilities.


You use you SSR% to calculate your annual Safe Spending Amount (SSA), or you use your SSR% to tell you how much you need for a desired spending level. Nest Egg Care shows you the math.


2. OBEY the Rules. Two are Critical.


RWCs have implicit assumptions built into them as to How to Invest. You have to follow the How to Invest rules explicitly if you are to trust that your SSR% is really safe. If you don’t follow the rules, you are distorting the shape of the hockey stick (SSR%) that you think is safe. You can distort it to the point that it is unsafe. Do NOT do that.


The first and most important rule (that almost no one really tells you about) is that you must match as nearly as possible future market returns. All RWCs assume market returns to build the sequences of returns we may face in the future. We all incur costs when we invest (e.g., costs of ownership of mutual funds), and we must have a low net Investing Cost (a subtraction from market returns). We have two options to be low cost: invest in inherently low cost index funds or invest in actively managed funds that overcome their greater inherent costs. Nest Egg Care comes down on the side of index funds.


The second rule is that you want and need a Reserve that’s apart from the amount you use to calculate your SSA. The Reserve is your buffer to carry you through a period of “bad variability,” particularly in stock returns. RWCs tell us we are safe in the face of horrible sequences of future returns, and 80% of the sequences they’ve built have at least two years of “bad variability” built into them. But it will be emotionally difficult for us when we are first hit: “bad variability” can shake our belief that we are truly safe.


When we are hit, we will tap the Reserve for our spending, not our portfolio we used to calculate our SSA. The plan is to replenish the Reserve when stock returns rebound.


3. RECALCULATE. It can only get better.


It’s almost certain that you won’t face the horrible sequence of returns that drove your initial choice of SSR% and resulting SSA to a low level. When you ride a better sequence you will accumulate more than is needed for your current SSA. If you ride along an average sequence of future returns you can expect to be able to spend perhaps twice your initial annual SSA. Nest Egg Care shows you how to recalculate to see if you are able to safely spend more. I suggest you recalculate at least every three years, but you can recalculate annually if that is not too burdensome. I do, and you can follow that calculation each December on this site.


If you aren’t on a path of depleting your portfolio, you’re going to be faced with delightful dilemmas: once you trust your SSR% and annual SSA calculation, you will know that it makes little sense to save any of your annual SSA; saving is just driving your future probabilities to almost ridiculously low levels. Nest Egg Care recommends that you “pay yourself(ves)” your complete SSA each year. Your objective by the end of the year is to not have one dime left: you’ve spent or gifted it all.


It’s a better retirement with more joy and meaning, I think. Your focus will typically be at the start of the year, “What’s the next fun thing to do?” And, typically later in the year, “Who should benefit from our increased giving this year. And how much.” Because one thing is certain: you’ll enjoy your retirement more when you gift to your loved ones and/or fund your favorite causes while you’re around to appreciate the positive impact you’ve made.


4. EXECUTE. Keep it Simple.


Picking the right investments is simple, and the portfolio Nest Egg Care recommends is shockingly simple. It’s so simple that I find I personally have to fight human nature and biases that lead us to think that the appearance of complexity (e.g., holding many types of mutual funds) is better than simplicity (holding just a few that in turn own a piece of every security traded in the world). Another bias we have to fight is the urge to fiddle, tweak and change our portfolio to give ourselves a sense that we are proactively exerting control over the future. That’s really an illusion.


You have initial organization tasks at the start of your plan. You need to get all your financial resources organized in one place. You want to make sure you and your life partner can see it all. You want to arrange and label your investment accounts so it’s very easy for you to understand once you’ve logged into your portfolio page. Nest Egg Care shows you an example that makes most sense to me.


Annual maintenance tasks are straightforward. Nest Egg Care provides a sample checklist and two spreadsheets that will help. You’ll recalculate to see if your SSA can increase; you’ll sell securities most tax efficiently to get your upcoming SSA in cash; you will rebalance back to your strategic mix of stocks and bonds; you’ll adjust your monthly “paycheck” from your investment account to your checking account. These tasks should take no more than an hour or two at the end of the year. Less, once you get the hang of it.


Understand the CORE. Trust your SSR% and pay yourself your SSA. Focus on spending to enjoy more now; gift what you don’t spend to those you care about. Do these things, and you’ll maximize the joys of retirement.