All posts by Tom Canfield

How is your Social Security benefit taxed?

The purpose of this post is to explain how your Social Security (SS) benefit is taxed. The percentage taxed ranges from 0% to 85%. How is the exact percentage calculated? When I google the question, I find the descriptions are VERY CONFUSING. It’s important to understand how your SS benefit is taxed year if you are subject to RMD. You can forego your RMD this year because of the CARES Act. Forgoing RMD obviously lowers taxable income this year, but it may also lower the percentage of your Social Security benefit that is taxable. Lower taxes on top of lower – really delayed –taxes.


And some can drive taxes even lower. They might be able to “manage” income – perhaps postpone sales of securities that delay capital gains taxes – to drive total Taxable Income (Adjusted Gross Income less the Standard Deduction) below ~ $40,000: that would lower capital gains tax to 0%. I wrote on this topic last year, but this post focuses on a clearer description of how SS benefits are taxed.


== Gory details but simple in concept ==


The details of how your Social Security (SS) benefit is taxed are in IRS publication 915, but it was Very Hard for me to fight through that and its worksheet to understand what’s going on. Here’s the basic concept:


The percentage of your Social Security benefit(s) that is taxed is determined by the amount of income you have in addition to your SS benefit. Low or relatively low amount of Other Income = none of your SS benefit is taxed. Moderate to more than moderate Other Income relative to your SS benefit = up to 85% is taxable income. High amount of Other income = 85% of your benefit is taxable income.


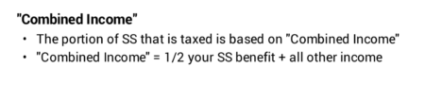
== “Combined Income” ==


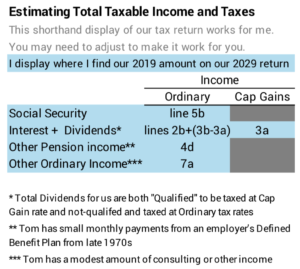
The amount of your SS benefit that is taxable depends on your “Combined Income”. This is a special term just for this calculation. Combined Income = ½ of your SS benefit + all Other Income. All Other Income for this definition is wages, interest income (taxable and tax exempt), IRA distributions, other retirement income, dividends and capital gains. See the IRS publication and worksheet for special tweaks.


== 1. Base Threshold.

2. $9,000 or $12,000 more.

3. The balance. ==


You can think of this as three tax brackets with a cap on the total percentage of your SS benefit that is taxable.


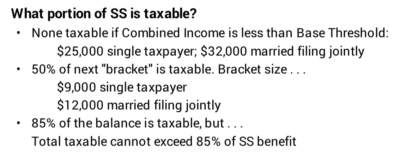
1. If your Combined Income is below a Base Threshold amount, none of your SS benefit is taxable. The Base Threshold amount is $25,000 for a single taxpayer and $32,000 for married, filing jointly.


2. 50% of the next amount of Combined Income, up to $9,000 more for single taxpayer and up to $12,000 more for married filing jointly, is taxable income. For example, for a single taxpayer, that’s up to a total of $4,500 taxable income for this bracket.


3. 85% of Combined Income greater than the top of the prior bracket is taxable. But the total taxable amount cannot exceed 85% of the full Social Security benefit.


== My generalizations ==


Here are my rough generalizations after playing with the spreadsheet here that you can download and use to figure out how much of your SS benefit will be taxed:


• Folks who have Other Income that is not more than ~60% of their full SS benefit have no taxable SS benefit;


• Folks who have Other Income that is ~160% of their full SS benefit will max out at 85% of the benefit as taxable income.


• Folks in between will see an increasing percentage that is taxable rising from 0% to 85%.
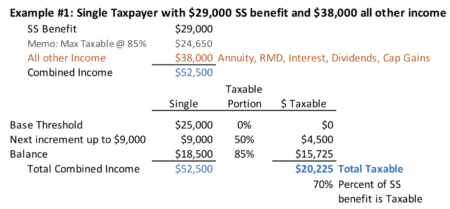
 

== Example #1 ==


In this example, Joyce, single taxpayer, has SS benefit of $29,000 and all other income of $38,000. (Other Income is about 130% of her SS benefit; she should fit in the “in between” category.) I assume in this example that $25,000 of the $38,000 is distribution from her IRA. The result is that 70% of Joyce’s SS benefit is taxable income: $20,225.


== What about 2020 and no RMD? ==


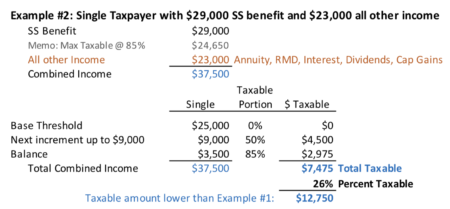
In 2020, Joyce is not required take RMD because of the CARES Act. But she wants $25,000 of gross proceeds from sales of securities for her spending in the upcoming year.


She decides not to take RMD but to sell taxable securities for $25,000 gross proceeds. Let’s assume 40% gain or $10,000 of capital gain income. That’s $15,000 less Other Income for the calculation of how much SS benefit is taxable income.


Example #2 shows the effect. The taxable amount of SS benefit drops to ~$7,500. ~$13,000 less than Example #1. At 12% marginal tax bracket, this is likely ~$1,500 lower tax.


And some may be able to get an added tax benefit. The lower total Taxable Income – lower in total by the $28,000 in the example above: $15,000 from substituting capital gains for RMD income; $13,000 from lower SS taxable income – would mean that none of Joyce’s $10,000 capital gain is taxed. Her total Taxable Income (Adjusted Gross Income less her Standard Deduction) would have to be less than ~$40,000 to get to 0% tax on capital gains. I described how this might work in last year’s post.


Conclusion: The taxable portion of Social Security benefits range from 0% to 85%. I I found it difficult to understand how that percentage is calculated. I tried to make the explanation clear in this post. I also provide a spreadsheet you can use understand how much of your benefit its taxable. It’s more important for older retirees who may chose not to take RMD to understand how Social Security is taxed this year. They could lower the percentage of taxable Social Security benefits and total income taxes by a meaningful amount.

Should you ever pay yourself MORE than your calculated Safe Spending Amount?

Yes, you should consider paying yourself MORE than your calculated Safe Spending Amount (SSA) particularly at the start of your retirement plan. You calculate your annual SSA in Nest Egg Care (NEC). (See Chapter 2). Paying yourself MORE than that probably doesn’t sound quite right to you; it sounds obviously inconsistent and unsafe. But the purpose of this post is to show that you can safely pay yourself significantly MORE than your initial, calculated SSA earlier in retirement with little meaningful effect on your SSA later. If I had it to do again – and I’m sure hindsight affects my view – I would have paid ourselves significantly MORE in the first three to five years of our retirement plan – and maybe more than five years.


== Is your initial SSA too conservative? ==


The steps you use in NEC to calculate your SSA makes the critical assumption that you will ALWAYS face the MOST HORRIBLE sequence of returns for stocks and bonds EVER. This critical assumption drives your calculated Safe Spending Rate (SSR%) and Safe Spending Amount – your SSR% times your Investment Portfolio – to a low amount. (Investment Portfolio = your total less an emergency Reserve; I recommend 5% off the top for your Reserves in Chapter 6.) I always like knowing that Patti and I will survive the MOST HORRIBLE ever. But the spending limit that we then set for ourselves is very conservative.


When returns aren’t MOST HORRIBLE EVER – let’s estimate that is 99% of the time for your whole retirement period – you will Recalculate to a greater SSA. SSA never declines. It can only be more. SSA will increase in real spending power because your SSR% is less than of the expected – long run average – returns for your mix of stocks and bonds. You’re withdrawing each year but typically earning more back.


When we compound the return difference over time and use the math that says we can safely take out a greater percentage, SSA grows to MUCH MORE over time.


Patti and are an example. We started our plan for spending for 2015 with SSA of $44,000 (per $1 million initial Investment Portfolio). The Summary Table in Chapter 9 of NEC shows that Patti and I calculated to 4.5% real increase in SSA in two years – for our spending in 2017.


Every December I show my annual recalculation. I’ve annotated our most recent spreadsheet here. It shows that for the following year – spending for 2018 – our cumulative increase was $52,800 in spending power. 20% more. $8,800 more per year than our start. +$700 per month. A healthy increase. (I’d use our multipler [Chapter 1, NEC] to get the total for us.) In perfect 20-20 hindsight, I’d conclude that we paid ourselves 20% too little at the start of our retirement plan!


(And our increase was 2% more for spending in 2020, and we’re on track to calculate to another increase for spending in 2021. Through August, we’ve earned back more than the percentage we withdrew last December. Returns in next three months will tell the tale for Patti and me.)


= Enjoying More when you are younger ==


Could you safely pay yourself more at the start of your plan? Can you increase the amount you pay yourself such that you aren’t underpaying – in effect – when you are younger and then overpaying when you are grayer and less energetic?


Yes, you can. How do you do that? You do that by taking an amount off the top of your Investment Portfolio and paying it out to yourself over, say, four years. I describe two comparisons:


• Option #1. Pay your calculated SSA at the start of your plan as I describe in NEC.


• Option #2. Take money off the top at the start of your plan that you will pay yourself in the next four years. This will lower your on-going, Option #1 SSA by a small percentage.


Let me describe the two options for the imaginary couple, Herb and Wendy. They are both 65. They have $1 million Investment Portfolio after their 5% Off-the-Top Reserve.


== Option #1: Net SSA + SS = pay of $6,000/mo. ==


The SSR% for Herb and Wendy is 4.2% (See Graph 2-7 and Appendix D, using Wendy’s ~21-year life expectancy). That means their initial, annual SSA is $42,000 (4.2% times the $1 million). Let’s call that $36,000 or $3,000 per month after taxes – from their nest egg. (That’s likely an over-estimate of their total tax bite, but let’s go with that for this example.) They’ll pay that out monthly: $3,000 per month. That’s in addition to Social Security or any other retirement income. I’ll assume their Social Security is $3,000 per month for the two of them. Their annual net to spend is $72,000 per year or $6,000 per month.


== Option #2: pay $10,000 + lower pay by $125/mo. ==


Herb and Wendy would REALLY like to spend more than $72,000. They particularly want to travel more while they are in good shape to do so. They’d love to have another $10,000 to spend per year for four family vacations. They’d love to think they could do this without concern for those four years. What could they do?


• Step A. Take $40,000 Off the Top – 4% – Off the Top of their Investment Portfolio. Then Recalculate to a revised SSA.


To simplify, let’s assume 4% off the top also lowers also lowers their annual SSA after taxes by 4%. That’s now annual SSA of $34,500v for spending. (I rounded $1,440 less to $1,500 less.) Their net pay from their nest egg is $34,500 and total annual pay is $70,500. That’s 2% less than Option #1. $125 less per month. At this level of income that $125 does not seem painful to me. Would you agree?


• Step B. Invest the $40,000 in a short-term bond fund (or leave in in cash if you like) and set up an automatic withdrawal plan to transfer $10,000 each year for four years to their checking account in the month they start thinking about travel plans for the year. Call that January. Let’s assume they earn enough such that the transfers are the same $10,000 in spending power over the four years. Their total annual pay for the next four years is $80,500 in constant spending power – meaning that that amount adjusts each year for inflation. That’s 12% more than Option #1.


• Step C. Wait for four years – perhaps fewer years – to recalculate to see if they have earned a potential increase in their SSA. Two factors point to greater SSA in four years. 1) The chances are that market returns will be positive over four years. 2) H & W’s SSR% increases by about 10% – from 4.2% to 4.6% over four years (See Appendix D, NEC.) Herb and Wendy very likely will calculate to a +10% real increase in their SSA in four years, and if they did, their total pay would be about $74,000. They’ve made up more than the 4% decline in their SSA and have more to spend than at the start of Option #1.


A 10% increase in SSA in four years is not unrealistic. Again, the spreadsheet shows that Patti and I calculated to 20% real increase in three years. My friend Alice calculated to +16% in her first year and added ~3% in her second year.


And what if the VERY WORST happened? Herb and Wendy start their plan on the MOST HORRIBLE pattern of returns. As a result, they cannot increase their SSA from the intial $34,500 for the rest of their lives; they spend the rest of their retirement on $125 less per month than it could otherwise have been. Is this really that bad? I’d look back on the memories of the four family vacations and not think of trading them for an added $125 per month. Would you?


== You will make this decision often ==


This is not crazy or a risky suggestion. You actually make a decision like this each year you find you could recalculate to a greater, real SSA. Patti and I have had to make this decision in three of the last five years.


We all can increase our SSA by more than inflation when we have More-Than-Enough to support our current SSA. We all will have More-Than-Enough when we earn back in a year more spending power than we withdrew before the start of the year. I calculate the More-Than-Enough for Patti and me in the spreadsheet. Patti and I wound up at the end of three of the last five years with More-Than-Enough. The annotated spreadsheet shows the most More we had was at the end of 2017 – $148,000; we’d use our Multiplier (Chapter 1, NEC) to get to the total amount for us.


We all have two options when we calculate to More-Than-Enough. 1) Do I take out the lump sum of More-Than-Enough (or some portion of it) to spend on ourselves (or donate or gift it) now? Or 2) Do I leave it there as part of our Investment Portfolio, which means our SSA increases? That means I’m effectively paying out the More-Than-Enough in increments in all future years as a greater SSA. (For consistency, my spreadsheet shows that Patti and I always make the second choice.)


If you make that former choice, you are doing exactly what this post suggests. You are taking out a lump sum and lowering your Investment Portfolio. You are lowering your SSA from what it otherwise would be; you will use that lower Investment Portfolio as the starting base – setting a new Multiplier, in effect – for all your future calculations of SSA.


Conclusion: If we use the recommendation of spending our Safe Spending Amount (SSA) in Nest Egg Care, we will likely find we are underpaying ourselves when we are younger. Maybe SERIOUSLY UNDERPAYING. We can safely pay ourselves MORE when we are younger. We do this by taking an amount off-the-top. We then pay that out to ourselves over several years. Our revised, on-going SSA will be a small percentage lower than it would otherwise be. If we experience normal returns, our SSA will increase; we will feel NO pain from too little to spend in the future.


What are expected, real returns for stocks and bonds?

What are the real – inflation-adjusted – expected returns for stocks and bonds? Expected returns – the average annual return rates we’ve experienced over a long history – are 7.1% for stocks and 3.1% for bonds. I think these rates of return are a good guide as to what we might expect over many years in the future. The purpose of this post is to explain the update of the graph I made two years ago.


I added two more years of return data to the graph. The long-term rates for stocks and bond are the same, but the graph now corrects an incorrect label. I misstated the long-term return rate for bonds as 2.3% per year. My bad. I’ve also used that rate in several other blog posts that I’ll correct.


I like this graph. I printed this .pdf file, folded it, and glued it in the first page of Appendix C of my copy of Nest Egg Care (NEC). The display is a good visual picture  of the power of compounding of returns. It also shows the periods of poor returns that we retirees hope to NEVER see: the several long periods of 0% cumulative return for both stocks and bonds and the several shorter periods of steep declines for stocks and for bonds.


The .pdf summarizes what I get out of the graph. Here is a bullet point summary.


• Expected returns. These are average, real or inflation-adjusted annual returns over a 93-year history. The graph displays the cumulative change of the real spending power of a portfolio. Annual stock returns average 7.1%. Bonds average 3.1%. Stock returns are 2.3 times that of bond returns (7.1%/2.3%).


Compounding of annual returns amplifies the return difference. I think of the effect of compounding in terms of the number years it takes for an investment double in real spending power. Years to double follow the Rule of 72. Stocks will double in every ~ten years (72/7.1). Bonds will double in real spending power every ~23 years (72/31). I’m sticking 10 and 23 in my head now. That’s replacing the 10 and the faulty 30 (72/2.3) that I had before.


Over 93 years, $1 invested in stocks on January 1926 compounded to $660 in December 2019: that’s the effect of ~9.3 doublings (93/10): 2, 4, 8, 16, 32, 64, 128, 256, 512, and part of the way to 1028. $1 compounded to $19 for bonds: that’s the effect of ~4.1 doublings (93/23). Stocks provided 35 times the spending power of bonds.


• Returns vary. If you are younger and in the Save and Invest phase of life, you have a very long time-horizon. You can tolerate bad variations in return. When I was saving for retirement I invested solely in stocks and ignored bad variability – and at times it was REALLY BAD. $2,000 that I invested in my IRA in 1984 grew to a healthy amount to spend, in effect, this year.


We retirees are in the Spend and Invest phase of life. We focus on – maybe obsess about – the bad variations in returns that can deplete our portfolio that we rely on for our spending.


• Periods of poor returns are UGLY. Both stocks and bonds have had long periods of 0% cumulative return. Stocks have had three stretches of 0% cumulative return lasting about 15 years. Bonds had a Verrrry Looooong stretch of ~50 years of 0% cumulative return.


Within those long periods of 0% cumulative return, both stocks and bonds have declined by at least 40% in spending power in just a few years. That’s UGLY and SCARY. The three most horrible periods for stocks – greater than 40% declines – are 1930-1931, 1973-1974, and 2000-2001-2002. The most horrible period for bonds – again greater than 40% decline – was the five-year period of 1976 to 1982. This blog post has more detail on UGLY.


We retirees sure DO NOT WANT TO EXPERIENCE YEARS LIKE THOSE, but our plan must assume that we do experience them since they occurred in the past. We basically assume that we’re ALWAYS at the start of these HORRIBLE periods. This assumption drives our spending rate – the biggest lever we have to control the risk of depleting our portfolio – to a LOW, LOW level. When we find we find we aren’t riding a MOST HORRIBLE sequence of return, we adjust our plan – we can actually safely spend more. (See Recalculate in Chapter 9, NEC.) (Patti and I have recalculated to 22% real increase in our Safe Spending Amount over the past five years.)


Conclusion. I updated my graph of cumulative real returns for stocks and bonds. The expected return for stocks over the period from 1926 through 2019 is 7.1%. The expected return for bonds is 3.1%. (This is rate is correction that I displayed on my earlier graph.) The difference in returns are magnified when compounded over many years. $1 invested in stocks in 1926 grew to $660 in real spending power at the end of 2019. For bonds it’s $19. You’d have 35 times more spending power from an investment in stocks.


The graph also displays the few UGLY periods we retirees we hope we don’t experience: three ~15-year periods of 0% cumulative returns for stocks; a 50 year period of 0% return for bonds! We’ve had three two- to three-year periods when stocks declined by more than 40%, and we had one five year period when bonds declined by more than 40%.

When will we be able to travel?

I think we’re all in suspended mode – or should be – about our travel plans. I wrote in this post that Experiences equal Happiness, and Patti and I would agree with that. For us new experiences = travel. Patti and I really look forward to international travel. We like the whole process: making a bucket list, deciding what’s at the top of the list, planning the details, and anticipating the trip once we’ve committed to it. This post describes how we and some others I’ve talked to are thinking about travel in the future. Patti and I have basically shifted what we had planned for 2020 to the last part of 2021, and that’s what most of our friends have done. But 2021 could be another lost year.


== Sands of time ==


Missing this year is more painful for us than it may be for you. Patti and I are in our mid 70s. While we’re in good health, I don’t think that Patti and I will be traveling nearly as much when we are in our 80s. Skipping 2020 could be 1/5th of the years we’ll have the health and energy to travel.


== Who will have us? ==


We obviously have our own concerns about travel, but some places we want to travel to won’t have us. They only want people entering from countries where the virus is suppressed. Our new case rate is too high, and that’s a real problem.


We always plan a trip to the UK. We love the walking there. The UK now requires entering travelers – even UK citizens – to quarantine for 14 days if they are arriving from a country with new case rates of greater than 20 new cases/1 million/day. That equates to less than 7,000 new cases for the US and we’re six to seven times that now. Something BIG has to change for our rate to get as low as the better countries of the world. (The source for this graph is here.)


US average rate of 126 new cases is +7X the rate of 17 in UK.


== Where is it safe to travel? ==


The flip side of who will have us is to decide on where it is safe to travel. We would not want to travel to a country with a high infection rate. And obviously we have a concern about healthcare in another country. If we get COVID-19 there, we know we could not come back to the US for care.


We would not consider travel to Spain or France now. Spain welcomed travelers in August and their new case rate exploded by a factor of 32 times; it’s no greater than the US.. Let up on it, and it can explode. France is about 3 times the UK line of 20.


Using this same filter of infection rates, it is not safe for us to travel to parts of the US. The US rate is two times that of France, for example. If we won’t travel to France, that means we’d only travel to places in the US where the rate of new cases is well below the US average. (The new case rate in our county is about 1/3 the US.) Some states – like Mississippi – are two times the US rate. Orange and Red on this map are OUT. (See here for source for this graph.)


== Treatments and Vaccine==


I’m optimistic about treatments that can reduce the effects of the virus: they can’t come soon enough. I’m optimistic about a vaccine, but there are a lot of uncertainties. Will it be tested enough to ensure it is safe? How effective will it be? When will enough be available to vaccinate 100s of millions of people? Where will Patti and I fall in the priority of who will be vaccinated? Will enough people decide to be vaccinated to provide ensure herd immunity, an added measure of safety?


Patti and I will not travel until we are vaccinated. Other friends – similar to us in age – are not as rigid as we on this point. They’ll decide closer to the time they will travel.


== The Shift ==


Patti and I have shifted our plans from 2020 to 2021. Top priority for us is the UK and we’re thinking staying longer than we typically stay. We’ll go to the Lake District again, but we’ll extend to walk at least the key parts of the National Trail along Hadrian’s Wall. The point we’d start is only about an hour train ride away from our usual haunts.


We made a deposit on a trip to southwest France. Patti wants to spend a week at a school in Tours to practice French. I got interested in human evolution a few years ago, and I want to visit the caves at Lascaux. We booked a walking trip and visit to Lascaux though an organizer based in France. We obviously cancelled that. They hold our deposit but will refund it if we don’t use it by fall 2021. Now we’re thinking Patti might might extend the time in or near Tours and explore the Loire Valley.


Conclusion: We aren’t travelling in 2020. We don’t have to think about new places to travel in 2021, since we’ll just follow through – hopefully – on our 2020 plans in 2021. But we still enjoy thinking about the details of how long we would stay and what we will do. We still get pleasure from anticipating the trips.

Should you rent when you are retired?

We should think about renting and not buying when we are retired. We should even think that selling our home and renting is NOT A HORRIBLE CHOICE. As the years roll by, I get more passionate about NOT SINKING CASH into non-financial assets – like our home. You want CASH OUT, NOT IN. I particularly want MORE financial assets ­– cash and investments on hand – in our taxable account; money there is valuable because it’s a low-cost source of cash for spending. I make some decisions to effectively rent and not buy. The purpose of this post is to describe how I’ve thought about rent vs. buy and how you might view the decision of selling your home to ultimately rent.


== Three decisions I’ll make to Rent ==


Our HELOC payment is Rent. I’ve had an interest-only HELOC for a number of years, but really didn’t use it. But now I use it for all home projects that maintain the value of our home. That means I use it when something breaks or is falling apart. I wrote a post about renting – in effect – a new furnace we had to install in January 2019. I’ve also included a stonework repair & landscape project. Now two ACs that sit on the roof of our house both went on the fritz in July. They’re scheduled to be replaced next week. That project will about double the rent we’ve been paying on our HELOC. We’ll rent our HVAC equipment and prior projects at about $75 per month.


The interest we pay on our HELOC isn’t exactly low cost. Our current rate is 3.3%, but the rate floats and very likely will increase over time. We don’t get tax deduction for the interest since we take the Standard Deduction. Therefore that 3.3% is my after-tax cost. That’s not expensive, but I do have money invested at lower return than this – short-term bonds in our Reserve [Chapter 7, Nest Egg Care (NEC)] are an example – but I really don’t want to touch them. I’m therefore paying more to rent: I pay a higher interest rate than I earn on some portion of our portfolio.


Our Mortgage payment is Rent. In effect, Patti and I rent about half our home. That means that over time, I’ve taken out cash – our current loan balance – that’s roughly equal to half the value of our home. I have to pay monthly rent in effect – principal and interest. I view that’s the same as if I had decided to sell half our home to someone else: they’d go to a bank, put up some equity, borrow the rest to finance the purchase, and then they’d charge me rent. The rent they would charge would include the effect of the principal and interest they’d have to pay and a profit for them. I’m getting a pretty good deal on this, since I don’t pay their profit margin.


I logically should fold in half of our property tax – use my HELOC to pay it – and include those added payments as rent. I just haven’t gotten there yet. I still pay our property taxes out of what I consider our FUN money – our annual SSA.


I value our mortgage. It’s an asset, not a liability, because it’s the major source of our money in our Taxable account. I could almost say that without our mortgage, we’d be close to $0 in our Taxable account.


Why is this? Over the years we’ve kept withdrawals from our Traditional IRA – and income taxes – low. That means I’ve preferentially sold securities in our Taxable account – at far lower tax cost – for our spending. We’ve let our Traditional IRAs run free as much as possible. Now the amount in our Traditional IRAs far outweighs the amount in our Taxable account. When you keep selling in your Taxable account to get cash for spending and get to be as old as Patti and me (we’re getting up there!), you may find your portfolio looks a bit like ours.


Lease future cars. We own our cars. I’ve never leased – effectively rented – our cars. One is six years old; the other is seven. We barely drive them now. I’m not sure when I’ll decide to get a new or better car. We’d be prime candidates for a self-driving vehicle if we could beckon one at will for all city trips, but that’s not in cards for the near future. I just can’t see laying out cash for a new or better car. I’ll lease, and I will not do the math to find the effective, relatively high interest rate I’ll be paying.


== The big decision: sell the house and pay rent? ==


I don’t think Patti and I will ever sell our house. We bought it thinking we wanted to live in for the rest of our lives. Patti focused on accessibility. For example, we have two steps to get into our home from our sidewalk and driveway and the total height of the two steps is under eight inches. Here’s the picture of the biggest step.


I can get up this 4 1/4″ step easily. Maybe when I’m in my 80s it will look more formidable.


But selling your home to eventually rent can be a very good move. A possibility is that you sell your home and move to assisted living.


My friend, Mary, is 77 and a widow. She’s active and in good health. She lives in a two-unit condo in a great location, one block from Walnut Street, Shadyside. She has ten steps up to the front door from the sidewalk, and her bedroom is on the second floor.


Mary thinks she might want to sell her home in a couple of years and move into an apartment with no steps to get in and no steps inside. How might that work out? I compare the two options relative to what Mary has been paying over the past 12 years.


• Including her current P+I, Mary spends about $2,000/month.


• Mary thinks an apartment that she might like in a location she might like would be $2,500/month. Heck, I’ll use $3,500.


• Mary thinks she’d net more than $450,000 on the sale of her home. Her condo has not appreciated much in the last 12 years; Mary would not pay capital gains tax on this sale. I’ll be conservative and assume she nets $400,000.


One way to look at this transaction: if Mary sells, she’d have $400,000 of cash proceeds and when she rents, she’ll have $1,500 added cash expenditure/month relative to what she pays now. Assuming 0% real return in the future – not a realistic assumption in my view – that works out to +265 months of rent – about 22 years.


Maybe a more realistic look: Mary’s financial health – and the amount she could leave to heirs – most likely will be better if she rents. For this example, I assume future returns on that $400,000 are close to the average historical return rates for stocks and bonds. I use the Future Value calculation in Excel to find how much Mary might have in a decade. I’ll use dollars in constant spending power – that’s means I assume her rent increases with inflation each year – and real, inflation-adjusted return rates.


Mary starts with $400,000 and spends an added $1,500 per month. In ten years she’ll have $460,000 in today’s spending power.


That $460,000 is probably more than Mary’s heirs would have if she never sold her home. Her condo has grown less than 1% in real value per year over the last 12. Real estate generally doesn’t increase by much more than 1% in real value over time. If I assume it increased by 1% per year in real value in the future, it would grow to $440,000 for her heirs.


Conclusion: An automatic default for most of our lives has been “Buy, don’t Rent.” Now that I’m retired and have reached my mid-70s, I’ve changed. I ALWAYS prefer to Rent, Not Buy. I don’t want to trade my financial assets for non-financial assets. I use my HELOC for the cash that my big non-financial asset – our home – demands over time: na new furnace and two new ACs are examples. My interest-only payments are the rent. In essence, we’ve sold half our home – to ourselves – and the P+I we pay is rent. None of us should fear selling our house to rent a place that is physically better for us: we can afford what appears to be higher cash outlays per month: it will likely work out to more money for us to spend to ENJOY or for our heirs.

Should my 40-year old niece contribute to a Target Date fund for her 401k?

My niece texted me last week. Her employer is being acquired, and her investment choices for the replacement 401k plan are completely different from those in her current plan. The plan identifies a default investment option, a Target Date fund offered by American Century. I’m pretty sure her default would be AROIX, the Target Date fund for 2045 (She’s 40.). (Target date funds are also called Lifecycle funds.) When you are many years from retirement, a Target date fund is invested in a greater mix of stocks. Over time the fund shifts to less stocks and reaches a final mix at the target date. My niece asked. “Is this a good choice for me?” This post gives my view on Target Date funds. I conclude that I don’t like them. Her plan offers options that are much better for her.


== What’s there not to like? ==


1. I don’t like the beginning mix of stocks and bonds.


My niece will rollover her current holdings into this 401k and add to it year after year. The first time she’ll withdraw ­– sell shares of this fund – is 25 years from now. That’s a holding period of 25 years on the current amount and additions this year. And she won’t sell all that’s there in 25 years; she’ll sell small increments each year – her annual Safe Spending Amount [See Nest Egg Care, (NEC) Chapter 2.]. That means some of the amount she has now will be around for another 20 years or so to 2065.


You could look at the stack of money she’ll have at the end of 2020 this way: some part has a holding period of 45 years! And another part has a holding period of 44 years. And so on down to 25 years. Those are loooong holding periods.


The fact sheet for AROIX shows its current mix is 74% stocks and 26% bonds + money market. My niece HAS TO BE 100% STOCKS for the shortest holding period of 25 years. She’d never choose to invest in bonds or cash for a 25-year holding period. Three reasons: 1) stocks are far greater in expected return rate; 2) over that many years the average annual return rate for stocks is more predictable than bonds; 3) the chance is near 100% that stocks will outperform bonds – and by a wide margin.


• Stock returns are about 2.3X that of bonds: the real return for stocks is 7.1% per year, and it’s 3.1% for bonds. 7.1/3.1 = 2.3X. Over 25 years at expected return rates, she’ll have three times as much from stocks as bonds. Over 35 years, the difference stretches to 5X.


• Stock returns are more predictable than bond returns for long holding periods. Math whizzes measure the variability of annual returns over different holding periods. (The measure is called Standard Deviation.) When they do that math on actual, historical return sequences, we find that stocks are less variable – more predictable – in annual return rate than bonds for all holding periods longer than 17 years.


• Statistics aside, bonds have outperformed stocks for a rare few 25-year holding periods over the very long history of accurate stock and bond returns. Those are times when bond returns have been unusually good while stock returns have been unusually bad. This happened because of one 20 or so-year stretch when bond returns were the best they have ever been. A stretch like that can’t be duplicated from today’s starting point.


Bond prices move in the opposite direction of interest rates. The more interest rates fall, the greater the increase in bond prices and total return. As an example, mortgage interest rates fell from 17% in 1982 to 5% in the early 2000s. That decline meant bond prices and total returns soared to result in about 7% real annual return for the next 20 years or so – far greater than their long-term average. We’re at less than 3% mortgage rates today. Interest rates can’t fall far enough for bond prices and returns to soar to match or exceed returns for stocks over that many years.


2. I can’t stand the ending mix of stocks and bonds.


The ending mix for AROIX is similar to other Target Date funds I find: 40% stocks and 60% bonds. You see this by selecting “GLIDEPATH” under Composition on that same page for AROIX. I shudder at the thought of retirees having a mix of 60% stocks and 40% bonds, and AROIX doesn’t even get close to this. My niece should NOT be entering retirement with that horrible mix of stocks and bonds.


Here’s the problem: we work back on what’s the proper mix of stocks and bonds at the start of her retirement – when she first starts to withdraw from her retirement plan. I run through this discussion in Chapter 8, NEC, and conclude there is little to justify less than 75% stocks. But I run two cases in FIRECalc and summarize them here:


Let’s assume you want 20 years of ZERO CHANCE of depleting your portfolio assuming the MOST HORRIBLE sequence of financial returns in history.


A mix of just 40% stocks buys you about $3,000 more per year of Safe Spending Rate (SSR%) than a mix of 75% stocks. That’s about 7% better.


But the cost – or tradeoff for that $3,000 more per year – is $700,000 in potential portfolio value if the return sequence you face is an average one. Would anyone really take $3,000 more per year with the expected result of having $700,000 less in 20 years?


This added $700,000 really means that my niece – at 75% mix of stocks – will Recalculate (Chapter 9, NEC) to FAR GREATER annual Safe Spending Amount (SSA) over time than if she was at 40% mix of stocks. How much more per year depends on how frequently she recalculates her SSA. But the ROUGH translation of that $700,000 works out to average $35,000 more per year in real spending power over 20 years – her approximate life expectancy at age 65 – than the starting $44,000: that’s the added $700,000 divided by 20 years.


Solution: just spend a few bucks less per year and use a mix of 75% to 85% stocks. You get the same safety – the same number of years of ZERO CHANCE of depleting your portfolio, but MUCH GREATER potential growth in your portfolio. Much greater growth translates to more to spend in retirement and/or much more in the future. That should be a very easy decision.


3. I hate the expense ratio.


The expense ratio for AROIX is .89%. WAY, WAY TOO HIGH. Over the 25 years to 2045, I’d estimate that the fund averages 50% stocks and 50% bonds. That means the expected return before costs is about 4.7% real return. The .9% is eating nearly 20% of the return potential and growth over time. THIS IS CRAZY. This fund combines low mix of stocks and high investing cost. DON’T GO THERE.


== Better choices ==


The plan had many other choices. A few were low-cost index funds. I recommended 100% stock and three index funds: the first two add to my attempt for the US total market. Her total investing cost is about .03% per year or 1/30th that of AROIX.


Conclusion: My niece asked if the default choice for her 401k – a Target Date fund – was a good pick. I do not like this choice AT ALL: too low mix of stocks now; too low mix of stocks on the target date; WAY, WAY too high of expense ratio that likely will consume 20% of growth over time. She had a far better choice of three index funds that cover US and International stocks. Her combined expense ratio is 1/30th of the default; she won’t be giving up that 20% of growth.

Have you started on your tax planning for 2020?

I spent some time this week planning for 1) where Patti and I will get our Safe Spending Amount for 2021 (SSA; see Nest Egg Care (NEC), Chapter 2) and 2) how much we will pay in total tax in 2020. I subtract 2) from 1) and get the net amount we can spend from our nest egg in 2021. I liked doing this now, well before I have to make final decisions in early December. This post simple describes what I did this week, and I provide a copy of the spreadsheet I used that may be of some help to you.


The task is pretty straightforward, especially in the earlier years of your plan, but a spreadsheet helps to finalize the details. I wrote a post on tax planning about six months ago, but I think this post and its spreadsheet are clearer.


== The BIG STEPS ==


Step 1. I have to estimate the gross amount – the amount before taxes – that I will withdraw in early December as our SSA-spending for 2021. That amount is the gross proceeds of securities I will sell.


Step 2. I estimate the total taxes I will pay in 2020; I’ve paid some using EFTPS for the first three quarters, because we don’t have Social Security withhold taxes; I subtract those payments and then know much to withhold in the withdrawal from our Traditional IRA I’ll take in December.


Result: I know how much cash, net of all taxes, Patti and I will have for our spending in 2021. I’ll disburse the amount out as monthly “paychecks” – automatic transfers – to our checking account.


== The smaller steps ==


1. Estimate our SSA that I’ll withdraw from our Investment Portfolio in December. I made this simple at this time. I just used the same gross amount that I calculated for 2020, $57,500 per $1 million relative to our starting portfolio in December 2014. I set a multiplier at the start of our plan – our initial Investment Portfolio divided by $1 million – that I use each year to get to our total SSA. (See Chapter 1, NEC.)


I’ll be more accurate in December. This surprises me: we could have a real increase in our SSA for 2021. Our portfolio return for the eight months is on track for a real increase. I only need about a one percent real return our portfolio this year to justify a real increase.


2. Estimate Social Security and other income. I need to estimate Social Security (SS) and other items of taxable income to make sure my final estimate of taxes to be withheld for the year is correct. I refer to my 2019 tax return. I increased SS by 2%, roughly increase from 2019. I use the exact other amounts from our 2019 return. Those other items are small for us and don’t change much.


I need to track the two kinds of income: 1) ordinary income – that’s primarily Social Security – and 2) income taxed a capital gains rates – “qualified dividends” on securities in our taxable account. (My brokerage tax reporting statement shows that I also have dividends that are not “qualified”, meaning they are taxed as Ordinary Income.) Ordinary income is subject to tax at marginal tax rates that run from 0% to 37%. For most of us, long term capital gains income is taxed at 15%.


3. Decide on the sources for our gross SSA withdrawal. The biggest part of our taxable income – and taxes – are from the sources of our SSA. I sell securities for our SSA in the first week of December each year and our total taxes for the year depends as to where I sell them.


I have three basic sources: 1) sell securities and withdraw from our in our Traditional IRA(s), 2) sell securities in our taxable account; 2) sell securities and withdraw from my Roth IRA (Patti does not have a Roth IRA.). I just listed those in order of amount in our portfolio, but I always arrange these three sources in my head from lowest tax cost to highest tax cost. I keep these three numbers in mind: 0%, 6%, and 22%.


I’ll always minimize taxes if I take my withdrawals in that order. In general, that’s exactly what you do. In general, you want to minimize taxes at the start of your plan, since your SSR% and your SSA will be lowest then: you want to net a greater percent after taxes for spending. You should be less concerned about greater taxes later because, unless you ride a MOST HORRIBLE sequence of financial returns, your SSA will increase in real spending power. SSA for Patti and me has increased by 22% in real spending power in the first five years of our plan.


== My order of sources is constrained ==


Patti and I are both over age 70½. We must first withdraw from our Traditional retirement accounts. (The CARES act waives RMD for 2020, but I don’t see an advantage of not withdrawing from our IRAs this year.)


(I ignore the wrinkle of Qualified Charitable Distributions or QCD for this post. If you are over age 70½ and wish to make charitable donations, you are best to donate directly from your Traditional IRA. You gain the tax benefit of the donation in addition to your Standard Deduction.) There is no limit to QCD this year, again due to the CARES act.


== I don’t absolutely minimize current taxes ==


Once we’ve taken our RMD in a normal year, I logically should take the balance first from Tom’s Roth IRA and then from sales of securities from our taxable account. That would give us the lowest possible tax bill every year. But I don’t ABSOLUTELY minimize current taxes each year.


Why not? If you carry the steps minimize taxes every year to its logical end, you first DEPLETE your Roth IRA(s), then you DEPLETE your taxable securities, and you are left in you later years with your Traditional IRAs as your only source of spending.


Patti and I have been depleting our lowest tax cost sources faster than our highest cost source. We started our plan with most of our Investment Portfolio in our retirement accounts. We’ve withdrawing from our nest egg for a number of years, and in the early years – before age 70½ – I resisted withdrawing from our Traditional IRAs.


I decided that I do not want to deplete by Roth + Taxable securities. Maybe I’ll rethink that in a few years. I set a rough target of no less than two years of spending in those two low-tax cost sources. If I used those two sources for our spending for 2021 – not taking anything from our Traditional IRAs – I can see that I could dwindle to that level pretty quickly. I therefore typically withdraw more than RMD from our Traditional IRAs for our spending. I don’t pay the minimum taxes that I could.


I particularly value my Roth. I already paid income tax on the amount I contributed. I want to get the best tax benefit when I use it for our spending. The painful tax – or cost – Patti and I could incur is a tripwire that increases Medicare Premiums; these are deducted from our gross Social Security benefit; if we stumble across a tripwire by $1, we could incur more than added $2,500 cost – lower net payment from Social Security in a year. That would be a VERY EXPENSIVE $1 of income.


The tax rates that trip added premiums for a single taxpayer is half these shown in this table; when one of us dies, the other very likely could cross a tripwire.


4. Enter taxable income and calculate tax to be withheld for the year. I enter all the withdrawals from our Traditional IRAs as ordinary income. I estimate the capital gain on sales of securities in our Taxable account. The spreadsheet adds to total ordinary Income and income taxed as long-term capital gain. I can use the 2020 tax table for find ordinary tax, and I multiply capital gains income by 15%. I add those two to total 2020 taxes


I add our first three quarters of estimated payments that we will make. (We each could have SS withhold taxes, but we don’t.) I subtract that from the total and find the net I have to withhold in the December from the gross withdrawals from our Traditional retirement accounts. Final Result: I have a good estimate now of the cash we’ll have for our spending in 2021.


Conclusion: I made a stab at our tax plan for 2020. I first estimated our Safe Spending Amount for 2021; at this time I just kept it the same as this year’s, even though looks like it could be more. I therefore have a pretty good estimate of what I need to sell – gross sales proceeds = SSA – the first week of December.


I figured out where I would sell: my Roth account (0% tax); our taxable account (roughly 6% effective tax); or our Traditional IRAs (let’s assume 22% marginal tax.) I can then estimate total tax for the year and the amount I will withhold from our gross distribution from our IRAs the first week of December.


Result: I have a pretty good handle on the net amount of cash we’ll have at the end of December that I’ll pay to our checking account throughout 2021. I’ll refine all this in the first week of December.

If you have a Variable Annuity, should you keep it or sell it?

Have you invested in a variable annuity? Last week I wrote that I would not invest in one as an option to help build a retirement nest egg. This case is different. It assumes you already have a variable annuity. What should you do? 1) Keep it and let it grow tax deferred; pay income taxes on your withdrawals for spending; or 2) Sell it and put the net proceeds in your taxable account; pay on-going capital gains taxes on dividends and then on accumulated gains on your withdrawals for spending? This post examines those two options.


My basic conclusion: the two options result in little difference in the net you will have to spend in your lifetime. But, depending on how much you withdraw during your life time for your spending, your final beneficiaries will get more if you sell and let the net proceeds grow in your taxable account.


== The plain vanilla version ==


I am comparing two options for a plain vanilla version of a variable annuity in this post. In this post I’ll assume you hold the exact same fund – or its mirror image – and that the variable annuity adds .35% annual cost to the alternative of holding a mutual fund in your taxable account. This is the same cost difference I displayed last week.


You always have the option of converting the value of your variable annuity to a fixed stream of payments – an annuity. You incur a cost for the guarantees the annuity offers, and you can add other features that increase the cost even more. Some of those features can add BIG costs, but I won’t explore whether the benefits you get for the features are worth those added costs.


Patti and I pay less than .05% cost on our portfolio value that drives our annual Safe Spending Amount (see Chapter 2, Nest Egg Care). You’ll be close to that following the recommendations in NEC. I’d look VERY HARD at what I’d get for costs greater than that.


== The starting point is different ==


The starting point differs from last-week’s comparison. Last week we started out with an amount to invest and looked at the choice of holding the same fund – or its mirror-image fund – in a variable annuity account or in a taxable account. A variable annuity loses out, primarily because of its greater annual costs. You want to keep your money in your taxable account.


For this comparison, you have less to start with in your taxable account. You have less because you first have to close out your variable annuity account and pay tax on the gain you’ve accumulated. This is roughly how the two options look for my friend, Mary, who has a variable annuity. If she closes out her variable annuity account now she’d have about 6% percent less to start out with in her taxable account.


I’ll use Mary’s example in this post. Mary and her husband (now deceased) bought the annuity and the security recommended by their financial advisor many years ago. Mary’s gain is not that high relative to the length of time she’s held it, because that was the first source of cash her advisor tapped when she asked for more to spend than she would have from her RMD. I have no idea why this was the first source of added cash, because it was not her lowest tax-cost source of cash:


When you withdraw from a variable annuity, you are first paying income tax on the gain portion ­– the next $20,000 of withdrawals in Mary’s case. That’s different than the way taxable income is calculated on your taxable securities: you pay tax on sales proceeds for the shares sold less your cost of those shares. That math results in far lower taxable income, possibly a lower tax rate, and therefore lower overall tax cost.


Mary’s in the 22% marginal tax bracket before considering any withdrawals from her variable annuity. That’s primarily from her Social Security, her monthly payments as the survivor of her husband’s defined benefit pension, and her RMD.


Let’s roll with Mary as the example and her 22% marginal tax rate for her withdrawals from her variable annuity. Your case most likely will be different, but I think the final conclusions will be the same.


• Greater added cost for the annuity favors selling it and investing the net in your taxable account. My assumption of .35% greater cost is low.


• You may be in the 12% marginal tax bracket; this will favor keeping the variable annuity.


== Same dollars to you, but more for your heirs ==


I display the summary I show on this detail for Mary. I calculated the net proceeds after paying all taxes that she’d have for spending in ten years. The difference in the two is within 1%. She comes out essentially the same. There is no compelling case to keep or sell the variable annuity.


It is compelling to sell and keep the net proceeds in a taxable account when one looks at the final end point after you or your surviving spouse have died and the beneficiaries are your children. On Mary’s death her children will pay income tax on the gain in her variable annuity, and I assume her children will be in the 22% marginal tax bracket then. Alternatively they pay no taxes on the value of her securities in her taxable account at her death. They get a step up in value that becomes their cost basis for the shares they inherit. They get 9% more in this example.


== What to do if you decide to sell ==


You’d prefer to sell when your variable annuity account on dips in value. That means your taxable gain will be low. You’ll pay less tax. A greater percent of the total goes into your taxable account. Less tax also means less chance of crossing a tripwire of income that would trigger greater Medicare Premiums.


The best time for Mary to have sold was when the market declined in March. The market declined by roughly a third. Mary’s account value may have declined from $70,000 to $50,000 – close to her $50,000 cost. If she sold then, she would have had no taxable income and incurred no tax. She would have started her taxable account without the current six percent penalty. (Too bad that I had not thought this through to tell her.)


Conclusion: If you have a variable annuity account, you likely have no compelling reason to keep it or to sell it and keep the net proceeds in your taxable account: you’ll have just about the same net to spend in retirement. But if you want to leave more to your heirs, the example in this post says you should sell it and invest the proceeds in your taxable account.

Should you invest in a Variable Annuity to help build your nest egg?

Variable Annuities are popular. Investors poured over $240 billion into them in 2019. I opened a variable annuity account at Fidelity maybe 15 or 20 years ago as added way to save for retirement. I’m not remembering my thought process, but I’d guess that I had contributed the max to our IRAs and had more I wanted to save for retirement. I was attracted to deferral of taxes on the growth that you get from a variable annuity; I’d only pay tax when I withdrew for spending. That tax deferral sounds appealing, but is it? The purpose of this post is to explain why I think you should NOT invest in a variable annuity to build your nest egg for retirement.


== Never as good as a Traditional or Roth IRA ==


Where do you invest for retirement? You have four basic options outside of your workplace retirement plan. You’re down to two options once you’ve maxed out on the amount you can contribute to your Traditional or Roth IRA: 1) open a variable annuity account and invest in one of the mutual funds it offers; 2) keep the amount your taxable account, invest in a broad-based mutual fund or ETF (See Chapter 11, Nest Egg Care) and pay capital gains taxes on the annual dividends and accumulated gains.


A variable annuity is somewhat similar to a Roth IRA, but clearly not as good. (I’ll use Roth as a comparison but Roth and Traditional IRAs give you the same after-tax dollars assuming the tax bracket at the time of investment or contribution is the same at the time of withdrawal.) You’re investing after-tax dollars, just like Roth. Like Roth, you don’t pay any taxes on the growth. But unlike Roth, you pay income tax on the growth when you sell and withdraw for your spending. This means a variable annuity will never match the results of your IRA – you won’t have the same after-tax results.


== Better than investing in a taxable account? ==


But the question is – once you’ve met your limits to invest in your IRA – is a variable annuity better than investing in essentially the same mutual fund your taxable account? The basic answer is “No.” Here are the two basic options and tax considerations:


Case #1: You have high enough income now that you pay 15% tax on dividends (and gains distributions) from your mutual funds. That means, basically, that you are in the 22% tax bracket; that’s the approximate threshold where gains taxes change from 0% to 15%. 


When retired, you believe you will have enough ordinary retirement income – e.g., Social Security, income from defined benefit retirement plans, and your withdrawals from your Traditional IRA ­ – that you will be in the 22% tax bracket. (In 2020, the 22% marginal tax bracket starts at Adjusted Gross Income of $107,650. Half this for single files over age 65.)


Conclusion: it makes NO SENSE to invest in the variable annuity. You do NOT want to defer paying 15% taxes to eventually pay 22% tax. The added benefit in growth from deferring payment of capital gains taxes can’t make up that difference.


Case #2: You have high enough income now to pay 15% tax on capital gains, but you are convinced that in retirement your ordinary income will NOT cross into the 22% tax bracket. You’re convinced that you’ll be in the 12% bracket for many years. (You will be well below the threshold stated above.)


If you invest in a variable annuity, you’re otherwise avoiding 15% tax on gains and eventually you’ll pay 12% on the growth. This starts to make sense: you get to keep about 4% more of the growth in this case. A variable annuity may be attractive.


== We’re not done yet: higher costs ==


You pay added fees for the privilege of deferring taxes on growth in a variable annuity. These costs are a direct reduction in the return you get.  What are the added costs?


You pay a Base Contract Expense on the value of your variable annuity in addition to the Expense Ratio of the fund that you invest in. (This article describes this expense as Insurance Charges.) Think of this as a fee that simply allows you to defer taxes on growth, because that it all it really does. The fee goes to an insurance company or perhaps an insurance subsidiary of the firm offering the variable annuity: Fidelity, Vanguard, or Schwab would be examples. Why is an insurance company involved and why is this a true added cost? I don’t know. That’s just the way the authorizing legislation set it up.


The Base Contract Expense varies widely. Morningstar reports that this fee averages 1.10% of portfolio value but ranges from 0.10% to 2.10%. This fee at Fidelity is .25%; it’s .27% at Vanguard; 0.60% at Schwab.


In some cases, you pay a greater Expense Ratio for the fund you own in your variable annuity account. Here’s an example: the same fund – or mirror-image fund at Fidelity – in the variable annuity has a total annual expense about .35% greater per year than the same fund in your IRA or taxable account. You’d expect the fund in your variable annuity to return .35% less year after year. This is the case in this example.


This added .35% expense lowers your expected your growth rate by about 5%. I divide the .35% added cost by the expected real return rate for stocks of 7.1%). This hit on growth is exactly why I closed out my variable annuity: it was easy for me to see that the accumulated growth in my variable annuity was far less than for the exact same fund in my IRA: I’d pay the same income tax rate when I withdrew from either one, but the fund in my variable annuity was growing far slower: I’d net far less.


== Back to Case #2: it doesn’t win  ==


You’ve gone backwards on Case 2 now that we added in the effect of higher costs for the variable annuity. You got a tax advantage that meant you got to keep 4% more, but you gave up 5% of growth per year. You’re behind the game. You can see on this pdf that the relative small difference in costs wipes out the advantage of lower tax rate (12% on withdrawals and a final sale) as compared to 15% taxes on dividends and at the final sale. There’s no advantage to a variable annuity. It’s simpler and you’d be better off to keep the amount in our taxable account than with the variable annuity.


Conclusion: Once you’ve maxed out on your contributions to retirement accounts, you may still want to invest for retirement. You have two options: 1) just keep the amount in your taxable account, invest in a mutual fund, and pay tax on the dividends through the years; 2) open a variable annuity account, invest in similar fund, but defer all taxes until you withdraw: you’ll pay income taxes then. As I work through the options and cost differences between the two, I find no logical reason as to why you’d want to invest in a variable annuity. It’s better – and simpler – to just keep the amount in your taxable account.

Is it time to sell stocks?

OMG. This article says 33% of investors over age 65 sold ALL their stocks this year! (This may have been FALSE NEWS*.) This is about the worst idea ever. Surely you didn’t do this. What does this tell us nest eggers? Those folks have NO financial retirement plan. They see the market variations as a roller coaster: that’s going to be a very emotional ride. We nest eggers see our financial retirement plan as a hockey stick. Our brains focus on the point that we’re worried about: the shaft length of our hockey stick. That’s the point that we’ve LOCKED IN that’s many years and perhaps decades away. It translates to many years of ZERO CHANCE of not being able to take a full withdrawal for our spending. But all this aside, I sold stocks this week! The purpose of this post is to explain why I sold stocks now.


[*This article states the original article in the WSJ was in error. This later WSJ article (behind paywall) implies the same.]


== A farmer pre-selling his crop ==


I’m thinking like a farmer. He plants his corn and soybean crops in May. He will harvest both in October and November but sell them in late November and December. He has a choice: do I just wait until late November or December and sell at the spot price for one or both of them, or should I enter into a contract or contracts now that guarantee a price per bushel for each – typically close to today’s spot price?


This is the same thinking that I used when I decided to sell bonds, my soybeans. I sold March 6 and again on March 10. I sold enough IUSB and BNDX so that I would not have to sell ANY stocks at our usual time to harvest – the first week of December for our spending for the upcoming year. The table shows my sales and prices as compared to the prices today.


I could judge that I’m behind in the game. I’ve “lost” a bit – perhaps 0.5% or a bit more since I’m not including some dividends that would have reinvested. Prices may be higher or lower in early December. The decision to lock in a price now may look good (Prices in December turn out to be lower.) or not so good (Prices in December turn out to be higher.). Just like the farmer, I’ll ignore the comparison and be happy that I prudently reduced risk.


== Portfolio return for 12 months ending Nov 30? ==


I’ve basically locked in the returns for for bonds for our calculation year – the 12 month period ending November 30. I use those 12-month returns to calculate our Safe Spending Amount (See Chapters 2 and 9, Nest Egg Care) for the upcoming year. At current money market returns – basically 0% – I won’t need to adjust these for our 12-month return.


I didn’t apply the same thinking in March to stocks, my corn crop. Stocks rolled off the cliff in late February and bonds kept improving to their all-time high in early March – now surpassed. But I applied that same thinking on Wednesday. I sold enough of FSKAX to roughly equal what I would normally sell in December for our spending in 2021. My return for FSKAX since December 1 is about +3.5%. Again, that would be the total through November 30.


I chose not to sell any VXUS. That looks a little silly as I now see it’s only off -2.3%. I can calculate our total portfolio return for our year ending November 30 had I sold VXUS and locked in its -2.3% return. The +2% total return will likely justify a real increase in our SSA for 2021 ­– an increase greater than an inflation adjustment. (This depends on the final number for inflation; the annual rate of inflation is roughly .5% now.)


I’ll keep scratching my head about why I wouldn’t want to sell VXUS now. I think my inaction now is a common financial-behavioral flaw: I don’t want to sell when I’d sell at a price that my brain says is a loss relative to some arbitrary point in the past.


== I may never pre-sell again ==


Every year a farmer makes the decision of whether or not to pre-sell some of his fall crop to avoid uncertainty in the December spot price. My plan has been to always sell at the spot price in the first days of each December. I do get a little antsy every November. But I figure that over many years I’ll even out short-term swings in prices from, say, early November to when I sell in December. That’s what I’ve done for the first five years of our plan. This is a very unusual time for sure, and this is the first time I’ve even thought about pre-selling. I think – I hope – that this will be a rare event.


Conclusion: We nest eggers have a solid financial retirement plan. We are far less concerned about the vagaries of the stock market. Those retirees with no plan see the roller coaster and tend to panic: an article stated that 33% of all retirees sold ALL their stocks this year. (Some other articles suggest this was overstated.) If you’re a nest egger, you have a plan and you didn’t come close to doing that. I judged this week, however, that it was prudent to sell stocks that I would normally be selling the first week of December. I decided I would be happy to receive today’s price then, so it made sense just to lock that price in.