Should you ever pay yourself MORE than your calculated Safe Spending Amount?
Posted on September 11, 2020
Yes, you should consider paying yourself MORE than your calculated Safe Spending Amount (SSA) particularly at the start of your retirement plan. You calculate your annual SSA in Nest Egg Care (NEC). (See Chapter 2). Paying yourself MORE than that probably doesn’t sound quite right to you; it sounds obviously inconsistent and unsafe. But the purpose of this post is to show that you can safely pay yourself significantly MORE than your initial, calculated SSA earlier in retirement with little meaningful effect on your SSA later. If I had it to do again – and I’m sure hindsight affects my view – I would have paid ourselves significantly MORE in the first three to five years of our retirement plan – and maybe more than five years.
== Is your initial SSA too conservative? ==
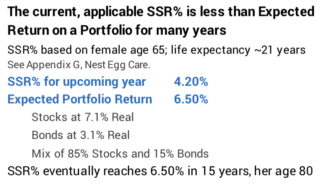
The steps you use in NEC to calculate your SSA makes the critical assumption that you will ALWAYS face the MOST HORRIBLE sequence of returns for stocks and bonds EVER. This critical assumption drives your calculated Safe Spending Rate (SSR%) and Safe Spending Amount – your SSR% times your Investment Portfolio – to a low amount. (Investment Portfolio = your total less an emergency Reserve; I recommend 5% off the top for your Reserves in Chapter 6.) I always like knowing that Patti and I will survive the MOST HORRIBLE ever. But the spending limit that we then set for ourselves is very conservative.
When returns aren’t MOST HORRIBLE EVER – let’s estimate that is 99% of the time for your whole retirement period – you will Recalculate to a greater SSA. SSA never declines. It can only be more. SSA will increase in real spending power because your SSR% is less than of the expected – long run average – returns for your mix of stocks and bonds. You’re withdrawing each year but typically earning more back.
When we compound the return difference over time and use the math that says we can safely take out a greater percentage, SSA grows to MUCH MORE over time.
Patti and are an example. We started our plan for spending for 2015 with SSA of $44,000 (per $1 million initial Investment Portfolio). The Summary Table in Chapter 9 of NEC shows that Patti and I calculated to 4.5% real increase in SSA in two years – for our spending in 2017.
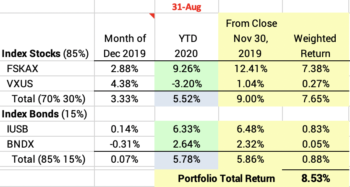
Every December I show my annual recalculation. I’ve annotated our most recent spreadsheet here. It shows that for the following year – spending for 2018 – our cumulative increase was $52,800 in spending power. 20% more. $8,800 more per year than our start. +$700 per month. A healthy increase. (I’d use our multipler [Chapter 1, NEC] to get the total for us.) In perfect 20-20 hindsight, I’d conclude that we paid ourselves 20% too little at the start of our retirement plan!
(And our increase was 2% more for spending in 2020, and we’re on track to calculate to another increase for spending in 2021. Through August, we’ve earned back more than the percentage we withdrew last December. Returns in next three months will tell the tale for Patti and me.)
= Enjoying More when you are younger ==
Could you safely pay yourself more at the start of your plan? Can you increase the amount you pay yourself such that you aren’t underpaying – in effect – when you are younger and then overpaying when you are grayer and less energetic?
Yes, you can. How do you do that? You do that by taking an amount off the top of your Investment Portfolio and paying it out to yourself over, say, four years. I describe two comparisons:
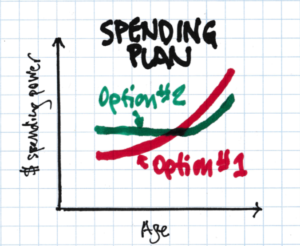
• Option #1. Pay your calculated SSA at the start of your plan as I describe in NEC.
• Option #2. Take money off the top at the start of your plan that you will pay yourself in the next four years. This will lower your on-going, Option #1 SSA by a small percentage.
Let me describe the two options for the imaginary couple, Herb and Wendy. They are both 65. They have $1 million Investment Portfolio after their 5% Off-the-Top Reserve.
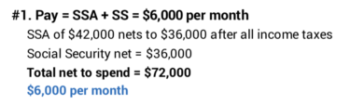
== Option #1: Net SSA + SS = pay of $6,000/mo. ==
The SSR% for Herb and Wendy is 4.2% (See Graph 2-7 and Appendix D, using Wendy’s ~21-year life expectancy). That means their initial, annual SSA is $42,000 (4.2% times the $1 million). Let’s call that $36,000 or $3,000 per month after taxes – from their nest egg. (That’s likely an over-estimate of their total tax bite, but let’s go with that for this example.) They’ll pay that out monthly: $3,000 per month. That’s in addition to Social Security or any other retirement income. I’ll assume their Social Security is $3,000 per month for the two of them. Their annual net to spend is $72,000 per year or $6,000 per month.
== Option #2: pay $10,000 + lower pay by $125/mo. ==
Herb and Wendy would REALLY like to spend more than $72,000. They particularly want to travel more while they are in good shape to do so. They’d love to have another $10,000 to spend per year for four family vacations. They’d love to think they could do this without concern for those four years. What could they do?
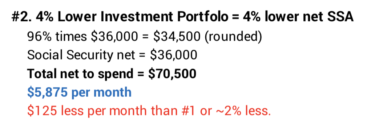
• Step A. Take $40,000 Off the Top – 4% – Off the Top of their Investment Portfolio. Then Recalculate to a revised SSA.
To simplify, let’s assume 4% off the top also lowers also lowers their annual SSA after taxes by 4%. That’s now annual SSA of $34,500v for spending. (I rounded $1,440 less to $1,500 less.) Their net pay from their nest egg is $34,500 and total annual pay is $70,500. That’s 2% less than Option #1. $125 less per month. At this level of income that $125 does not seem painful to me. Would you agree?
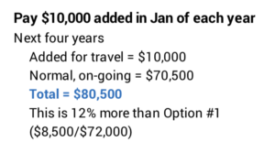
• Step B. Invest the $40,000 in a short-term bond fund (or leave in in cash if you like) and set up an automatic withdrawal plan to transfer $10,000 each year for four years to their checking account in the month they start thinking about travel plans for the year. Call that January. Let’s assume they earn enough such that the transfers are the same $10,000 in spending power over the four years. Their total annual pay for the next four years is $80,500 in constant spending power – meaning that that amount adjusts each year for inflation. That’s 12% more than Option #1.
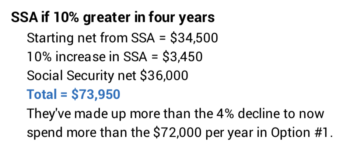
• Step C. Wait for four years – perhaps fewer years – to recalculate to see if they have earned a potential increase in their SSA. Two factors point to greater SSA in four years. 1) The chances are that market returns will be positive over four years. 2) H & W’s SSR% increases by about 10% – from 4.2% to 4.6% over four years (See Appendix D, NEC.) Herb and Wendy very likely will calculate to a +10% real increase in their SSA in four years, and if they did, their total pay would be about $74,000. They’ve made up more than the 4% decline in their SSA and have more to spend than at the start of Option #1.
A 10% increase in SSA in four years is not unrealistic. Again, the spreadsheet shows that Patti and I calculated to 20% real increase in three years. My friend Alice calculated to +16% in her first year and added ~3% in her second year.
And what if the VERY WORST happened? Herb and Wendy start their plan on the MOST HORRIBLE pattern of returns. As a result, they cannot increase their SSA from the intial $34,500 for the rest of their lives; they spend the rest of their retirement on $125 less per month than it could otherwise have been. Is this really that bad? I’d look back on the memories of the four family vacations and not think of trading them for an added $125 per month. Would you?
== You will make this decision often ==
This is not crazy or a risky suggestion. You actually make a decision like this each year you find you could recalculate to a greater, real SSA. Patti and I have had to make this decision in three of the last five years.
We all can increase our SSA by more than inflation when we have More-Than-Enough to support our current SSA. We all will have More-Than-Enough when we earn back in a year more spending power than we withdrew before the start of the year. I calculate the More-Than-Enough for Patti and me in the spreadsheet. Patti and I wound up at the end of three of the last five years with More-Than-Enough. The annotated spreadsheet shows the most More we had was at the end of 2017 – $148,000; we’d use our Multiplier (Chapter 1, NEC) to get to the total amount for us.
We all have two options when we calculate to More-Than-Enough. 1) Do I take out the lump sum of More-Than-Enough (or some portion of it) to spend on ourselves (or donate or gift it) now? Or 2) Do I leave it there as part of our Investment Portfolio, which means our SSA increases? That means I’m effectively paying out the More-Than-Enough in increments in all future years as a greater SSA. (For consistency, my spreadsheet shows that Patti and I always make the second choice.)
If you make that former choice, you are doing exactly what this post suggests. You are taking out a lump sum and lowering your Investment Portfolio. You are lowering your SSA from what it otherwise would be; you will use that lower Investment Portfolio as the starting base – setting a new Multiplier, in effect – for all your future calculations of SSA.
Conclusion: If we use the recommendation of spending our Safe Spending Amount (SSA) in Nest Egg Care, we will likely find we are underpaying ourselves when we are younger. Maybe SERIOUSLY UNDERPAYING. We can safely pay ourselves MORE when we are younger. We do this by taking an amount off-the-top. We then pay that out to ourselves over several years. Our revised, on-going SSA will be a small percentage lower than it would otherwise be. If we experience normal returns, our SSA will increase; we will feel NO pain from too little to spend in the future.