I helped Alice with her year-end tasks this week
Posted on November 9, 2018
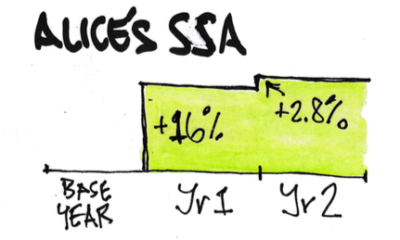
Alice’s Recalculation date is October 31 (see Nest Egg Care, Part 3). She follows the CORE and recalculates each year. Returns in 2017 were terrific, and Alice’s Safe Spending Amount (SSA) calculated as +16% last year – well above the 2% inflation rate. Returns this year won’t justify a real increase. Alice will pay herself the same amount she did last year adjusted for 2.8% inflation. The purpose of this post is to describe the year-end tasks. (Also see Nest Egg Care, Chapter 13.) We had two tasks: decide next year’s SSA and decide how to get it into cash.
==== Decide SSA for 2019 spending ====
1. I entered three pieces of information on Alice’s spreadsheet that looks similar to ours: inflation for the year (2.8%); the 12-month return for her stocks (2.5%); and the return for her bonds (-1.9%). (You have template of a spreadsheet for your SSA calculation in the Resources section on www.nesteggcare.com.)
2. The spreadsheet calculates the rest. It first calculates her Safe Spending Amount (SSA) for 2019 if it increased by the 2.8% inflation adjustment. It then calculates the alternative: the spreadsheet uses her current portfolio value and calculates the SSA that it could support. If her portfolio value increased enough, that value will be greater than the inflation-adjusted value. She uses the greater of the two.
The spreadsheet says she has to use her current SSA adjusted for inflation. Alice’s Safe Spending Rate (SSR%) last year was 5.3%. That’s what she withdrew from her Investment Portfolio last year. To justify an increase in her SSA, she’d need to basically replace that withdrawal – have a real (inflation adjusted) portfolio return close to that 5.3%; thats about 7.7% with the 2.8% inflation this year. But her portfolio return for this year was 1.4% – her combination of the 2.5% for stocks and the -1.9% for bonds. (Our SSR% increases as we age – we aren’t worring about as many target years of zero probability for depleting that we did when we were younger – and this means we don’t quite have to earn back what we withdraw to justify a real increase in SSA.)
========
I look at real return rates to understand what’s happened. The real return for Alice was -1.4% for the year. That was her combination of real return of -0.3% for stocks and -4.6% for bonds.
I focus on stock returns: they’re great on average but not good at all at times. I view bonds simply as insurance. I’m less concerned about them. Bonds aren’t going to sink our ship, but stocks can because they can bunch up a few years of really horrible returns.
None of us like to see any decrease for stocks, but returns below 0% are not unusual. Statistically, the -0.3% return is about a one in three-year event: that’s saying that we could expect to see stock returns below zero in one in every three years.
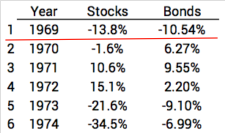
And the slightly negative return for Alice is nowhere close to the first year of the most horrible sequence of returns I find in the past. That’s the one we always assume for our planning. It’s the one that the drives our SSR% and therefore our SSA to a really low level. You can see the snapshot of that return sequence below and read here. The first year of that sequence started with real stock returns of -14%. The -0.3% looks darn good compared to that. (You can also see the back to back HORRIBLE real stock and bond returns of 1973 and 1974 .)
==== Decide what to sell ====
The remaining maintenance tasks were straightforward. Her SSA is the total value or pre-tax proceeds of securities she needs to sell. She needs to know how much stocks and how much bonds to sell. I used the spreadsheet shown under Resources on the home page at www.nesteggcare.com. That made short order of the task. After the sales, Alice winds up with her portfolio in perfect balance (e.g., mix of stocks and bonds).
The spreadsheet mentions that it can be a bit tricky to figure out what specifically to sell (Taxable or Tax Deferred) for lowest tax cost and therefore highest net cash for spending. Alice’s RMD is well below her SSA, but deciding what else to sell was not complex in her case. Once we had the net cash (after withholding for taxes) from her gross SSA for 2019, we adjusted the monthly payments from Alice’s Fidelity account to her checking account: 2.8% more than last year.
Conclusion: To find your Safe Spending Amount (SSA) for the upcoming year, you enter three numbers on a spreadsheet and it calculates the rest. Alice found – as I think all of us will find this year – that returns on her portfolio did not support an increase beyond the normal increase for inflation. Once you know your total SSA for the upcoming year, you sell securities to get SSA into cash; you use a second spreadsheet to make sure you sell correctly: you end with your portfolio in perfect balance. The tasks are not difficult. They just take some time. It’s less and less each year as you get comfortable with the routine.