I shudder at the institutional default of 60% stocks and 40% bonds.
Posted on March 16, 2018

A prior post discussed the insurance value of bonds. When stocks tank, bond returns are always better and almost always MUCH BETTER – as much as 63 percentage points better in a year. Since we retirees are selling securities each year for our spending, we want the insurance value of bonds when stocks tank: we sell (mostly or solely) bonds when stocks tank. But how much of this kind of insurance do we want to buy?
You make your decision on your complete insurance package – and bonds are just one part – in Part 2, Nest Egg Care. After reading that I think you’ll agree: an insurance package that includes 40% bonds simply means you are over-insured.
I stated in the last post that stocks had to be the dominant portion of our portfolio. Stocks are the fuel that will provide More-For-Us (and our heirs) when we don’t ride a HORRIBLE sequence of returns, and the probability of a truly HORRIBLE sequence is low. Bonds don’t nearly have the same fuel value. This post elaborates on the much greater fuel value of stocks versus bonds.
My conclusion: I shudder every time I think of someone in their 30s or 40s saving for retirement 30 to 40 years down the road and accepting a mix of 60% stocks and 40% bonds – often called the institutional default. My friend Larry went to a financial advisor decades ago, and that’s how he’s been invested. It looks okay to him, since his portfolio obviously has grown. But his total would be MUCH MORE had he had a greater mix of stocks.
My conclusion: I also shudder at recommendations to retirees for 60% stocks; one I read recently is for 55% stocks.*** After you’ve finished Parts 1, 2 and 3 in Nest Egg Care, that low mix of stocks should not make ANY sense to you. The plan you develop will be safer with a greater mix of stocks and provide MUCH More-For-You (and your heirs) when you ride other than a HORRIBLE sequence of returns.
Stocks are are much better fuel than bonds. Stocks compound to much greater value that bonds. In Nest Egg Care, I state that stocks average roughly 6.4% real return per year while bonds average 2.6%. That was from data through 2012.* When I get source data** and update through 2017, I get slightly different rates: greater for stocks; less for bonds. But the conclusion is the same: the long-term, average annual return rate for stocks is about 2.5 to 3 times that for bonds.
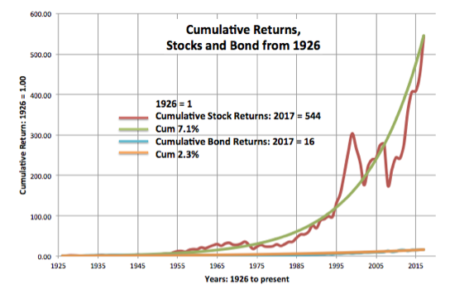
That difference in return rates compounds to a big dollar difference over time. You see the dramatic effect of compounding of returns for stocks and bonds in this graph below. It uses a linear scale for the Y-axis. (Full display that you can print here.) Stocks look like they are shooting for the stars. Bonds look like they fell asleep. Yes, the numbers are correct: stocks have compounded 544 times since 1926 and bonds 16. Stocks have compounded about 33 times more than bonds.
You can see the trends for stocks and bonds more clearly on a semi-log plot. With this plot, each increment on the Y-axis is the same percentage change. The green trend line (stocks) is 7.1% annual rate of increase since 1926, and the orange trend line (bonds) is 2.3% increase.
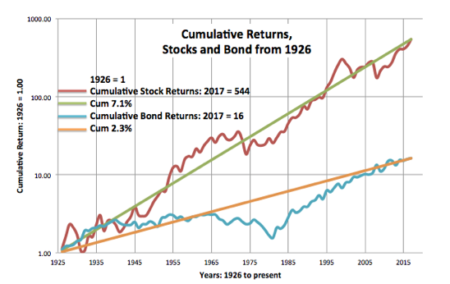
1. As stated in the last post, stocks have had three periods of essentially zero percent cumulative growth: I can draw horizontal lines connecting points along the red line for the 13-year period starting in 1930; the 17-year period starting in 1966; and the 12-year period starting in 2000.
2. For stocks, periods of high return rates have been from starting points on the red line that are below the green trend line. For example, a line from any point from about 1974 to 1985 to the present will be steeper than the green 7.1% trend line. That means the return rate is greater than 7.1% for those lines. (That’s what made my returns from my IRA investments in 1981 and 1982 so terrific.)
3. Bonds had a 44-year period of essentially zero cumulative growth: from 1941 to 1985. (I can draw a horizontal line connecting those years on the blue line.) Wow! 44 years! Inflation in 1940 was about 0% per year and it peaked at about 12% in the early 1980s. Bond prices change in the opposite direction of interest rates: as rates increased in line with inflation and expectations, bond prices fell and the total return from bonds fell.
4. Bonds have declined more than stocks for some time periods. I bet that’s a surprise. You can see that bonds have departed more widely from its trend line than stocks have departed from its trend line.
• Bonds declined by about 50% over the 17-year period from 1965 to 1982. (This was a period of inflation change from about less than +2% to over +10% with even greater change in interest rates.) The worst cumulative return for stocks over 17 years is 0%.
• Bonds declined -41% over the 5-year period from 1977 to 1982. The steepest five-year decline for stocks is -39%.
5. For bonds, periods of high return rates have been from starting points on the blue line that are below the orange trend line. You can see a steep improvement in bonds from the depths of 1982: bonds increased by 125% over the next five years. This is a period where inflation and interest rates fell (Inflation from about +12% in the early 1980s to about 4% by the late 1980s.); therefore, bond prices increased dramatically. That’s a steeper increase than all but one five-year period for stocks. But since that spurt for bonds 30 years ago, stocks have accumulated to twice that of bonds.
It’s impossible to envision now that bonds will have periods of steep increases in return. In the 1980s one could have concluded that bonds were fuel for growth for More-For-Us: we could have anticipated that inflation and rates would crater and therefore bond prices would explode. But you can’t conclude that now. They’re basically on their trend line and have been for some time. Inflation and interest rates just can’t fall enough from current levels for prices and total return for bonds to increase that much.
Conclusion: Bonds are very good insurance for years when stocks tank. We want to hold them for that insurance value, and we want to make sure we have the right amount of insurance. But bonds aren’t good fuel value for the growth of our portfolio. Over the very long term, bonds have been about 1/3 the fuel value of stocks and compounding of returns makes it a poorer fuel than that. The exception has been the period from the depths of bond returns in the early 1980s. We want the potential for More-For-Us (and our heirs) in the future. For that, stocks must be the dominant portion of our retirement portfolio.
* I used the data from Chapter 5 Stocks for the Long Run, Jeremy Siegel. Fifth edition.
** Stocks, Bonds, Bills, and Inflation (SBBI) Yearbook. Ibbotson and Grabowski. This contains real return rates for stocks and bonds from 1926. I used in this post the return rates for Larger Company Stocks and Long Term US Government (higher grade) Bonds; this choice is consistent with other publically available sites that show bond returns from 1926.
*** This article recommends a mix of 55% stocks and 45% bonds for retirees.