Patti and I are writing our checks for donations to charities this week. I’d guess this is the time of year you’ll be writing most of your checks. Patti and I made our major decisions a month or so ago. The purpose of this post is to state the ways to donate to make sure you get the maximum tax benefits.
Last year your donations would not be deductible unless you itemized deductions. The IRS says almost 90% of all taxpayers take the Standard Deduction. The Standard Deduction for 2020 is $12,400 for each taxpayer and an added $1,300 for tax payers over the age of 65.
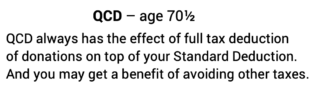
2. If you are over the age of 70½ this year, you should ALWAYS first pay all your donations to charities directly from your Traditional IRA account. You are throwing away money – paying taxes you shouldn’t – if you don’t. You should have a checkbook for the account that you use for donations. You’ll record the checks you write as donations as Qualified Charitable Distributions (QCD) on your tax return. These donations have the same effect as the special $300 for 2020: you effectively have the benefit of QCD of being 100% tax deductible on top of your Standard Deduction. The QCD limit is $100,000 for each taxpayer.
You get an added benefit from QCD because these withdrawals from your IRA are not included in your calculation of income – your Adjusted Gross Income (AGI). That’s different than your other withdrawals from your IRA. Since QCD does not increase your AGI, you may avoid running into tax tripwires from high AGI. I HATE tripwires for Medicare Premiums – the amount deducted from our monthly Social Security benefits. A tripwire – and there are several – that you accidentally cross by just $1 of too high of AGI costs roughly $1,250 per taxpayer.
This benefit is of help to the RARE individuals who have or understand that they will have More-Than-Enough. For a retiree that means your Safe Spending Amount (SSA; see Chapter 2, Nest Egg Care) is more the amount you want to spend to be happy. These individuals already donate a lot or plan to donate a lot in the future.
Maybe you typically donate a lot and run up against the 60% limit of AGI for current-year deductions for donations. Donations more than this have to be carried over to future years but can’t be carried forward for more than five years.
Maybe you are the rarer individual or couple who have a large IRA and plan on donating some or all of it at death. And you can foresee that you might pay taxes that you would like to avoid. You know that your RMD will double from your first-year amount at normal returns for stocks and bonds. If there are two of you, an ugly tax bracket that you might want to avoid will be half as far away as it is now when it’s only one who’s alive. You have a one-time opportunity in 2020 to simply right-size your IRA to avoid future taxes that simply don’t make sense to pay. You’re making donations now that you would plan on making at death.
Conclusion: It’s the time of year most of us write checks for donations to charities. We want to make sure we get the most tax benefit – pay the least taxes. The CARES Act of 2020 allows the first $300 of donations to be deducted from income on top of the Standard Deduction. All retires over age 70½ must first donate from their IRA as Qualified Charitable Distributions to get a similar tax benefit on top of the Standard Deduction. The CARES Act allows 100% current year deduction for donations to charities this year; certain individuals and retirees with More-Than-Enough may find this of benefit.
Is this a good time to retire? Is this a good time to be retired? I’d say YES and YES. (I’m ignoring Covid-19, of course.) Two reasons: 1) Covid-19 has shut us all down: our spending is down to the basics. We’ve been shut down, and we all know the spending beyond the basics that will make us happy. 2) Your financial portfolio has NEVER BEEN BETTER in your life. The purpose of this post is to discuss why you should feel pretty good about retirement now.
== Your spending has crashed ==
The fact that your spending has crashed is not all bad. You don’t have much to spend on other than the basics. If you didn’t know what you spent on the basics before, you should know now. I dove into the details of our basics last month.
I see that effect in our checking account. It is really is SWOLLEN and it will get bigger by the end of the year. I’ve continued to pay our monthly SSA for 2020 from our investment account at Fidelity to our checking account, but due to another refund of airfares, I won’t pay a credit card bill this month or next.
== What spending makes you happy? ==
We have been forced to think about what it is that we really miss. For Patti and me it’s time with family and friends and travel. US travel and visits with family and friends don’t cost much. The things that cost are the experiences Patti and I like to buy – international travel. We really missed our annual walking trip to England this year, and we know we want to go back. We’ve never been to Tuscany, and we had a great trip planned that we put on hold. I’m anticipating taking those trips BIG TIME. My friend Betty says we should add Japan and New Zealand to our bucket list.
I’m optimistic about the vaccines. Given our ages, we should be in the first 20 to 30 million or so to be vaccinated. If we’re vaccinated by late spring, we might be able re-create some our 2020 travel plans in 2021. I’d guess that we’ll be short on spending on experiences in 2021.
== The big burst of growth ==
• If you were nervous about starting out in retirement, you should be A LOT LESS concerned now. You have more money now than you ever had in your life; the US stock market peak was earlier this week. If you had a Safe Spending Amount in mind that would make you happy in retirement, I’d guess you are there now: returns and growth of your portfolio have been terrific.
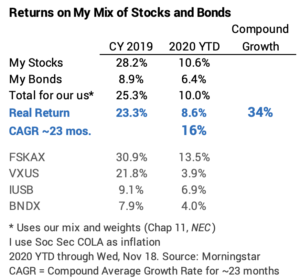
I’m amazed at how this year seems to turning out for both the stock and bond returns. Returns in 2019 were outstanding and they’ve been excellent so far this year. The expected real return for my portfolio is 6.5% per year, and our return has averaged ~16% per year over the past ~23 months. You should be very close to those returns and have a portfolio with +33% in more in real spending power than you had just two years ago.
That added portfolio value directly translates directly to 33% more in your annual Safe Spending Amount (SSA, Chapter 2 Nest Egg Care). Example: If you had $1 million two years ago and you thought your SSR% would be 4.4% in two years when you’d retire, you likely were planning that you could spend $44,000 from your nest egg. Now with 33% more, you can spend $58,000 – $14,000 in more spending power per year for the rest of your retirement. That’s a BIG BOOST in happiness.
• If you’ve been retired, you have to be ecstatic with what’s happened to your SSA and your portfolio over the last four years. You’ve experienced what Patti and I have experienced. Your SSA has increased by roughly +25% in real spending power. That’s true no matter your age and no matter your mix of stocks and bonds (I assume your mix of stocks and bonds is in the range I recommend in Chapter X NEC.). And, even though you’ve been withdrawing each year, you still have at least 10% more portfolio value – measured in the same real spending power than you started with. You also have MORE THAN YOU EVER HAD in your life.
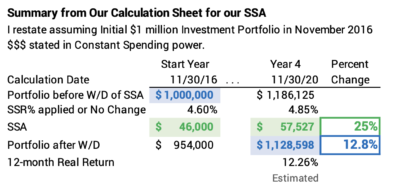
I give a snapshot of the last four years, adjusting our calculation sheet to assume we started our retirement with our first withdrawal for next year’s spending in December 2016. (I’m using results for us for 2020 as of Wednesday, seven days short of the final returns I’ll use as of November 30.) You can see the spreadsheet for the four years here and our calculation sheet last November 30 as reference.
== What’s this mean for the future? ==
We don’t know anything about future returns, but we are in a really good spot now. We can take the view that we have extra – maybe more than we should. We can tweak our spending to create an added a cushion. Here is what I’d consider:
• Set aside some of the money you’ve accumulated in your checking account this year. (I assume you’ve been paying yourself your 2020 SSA steadily throughout the year, and that your checking account is as swollen as Patti’s and mine.) Carry some into 2021 such that you start the year with a big fat amount in your checking account. You’ll be putting pressure on yourself to spend it to Enjoy, and that’s a good thing.
• Don’t withdraw your full SSA for your spending in 2021. If you calculate the same way we do – just after the 12-month period ending November 30 – you’ll calculate to about +10% increase in your SSA for 2021. Base your SSA for 2021 on 95% of your Investment Portfolio, not all of it. In essence, you’re assuming the market is overvalued by 5% and will correct itself.
You’ll increase your SSA, but it will increase by 5% less than you would otherwise calculate. I’d bet you’re not going to miss that extra 5%. You’re giving yourself added cushion and increasing the potential for future increases in your SSA. I’d recalculate each year for sure, like I do the first week in December, to see when you can next increase your SSA. Chances are you’ll see a +15% real increase every four or so years.
I’m leaning to do both: I’m pretty sure we’ll enter into 2021 with a much bigger balance in our checkbook than normal, and I plan on not paying ourselves the full increase I will calculate after November 30.
Conclusion: Covid-19 has been a drag on enjoying life. Everything has been on hold since early March. But good things have happened.
We’ve all slashed spending: we’re down to the basics. We are very clear as to what we want to do to Enjoy More Now and how much that will cost in the future.
Returns for the last two years – more years than that really – mean our financial portfolio is THE BEST IT’S EVER BEEN in our lifetime.
If you are just starting your retirement, you can safely spend ~33% more from your nest egg than you thought you could spend just two years ago.
Those of us who are retired have seen our Safe Spending Amount increase by about 25% over the last four years. We have the ability to create a bit of a cushion for the next year or so: our cushion for 2021 is the cash we haven’t spent from our 2020 SSA, and it is easy for us to pay ourselves less than our full SSA that we’ll calculate for spending in 2021.
Can you really lower taxes by skipping RMD this year? The CARES Act gave us older retirees the option of not taking our RMD this year. The IRS says something like 80% of folks must take their RMD for their living expenses. I’ll assume you are in the 20% that don’t need to take RMD for your spending: you could skip RMD and sell securities in your taxable account for your spending. This post describes when skipping RMD could really save on taxes. My basic conclusion is that the potential to save taxes applies to those who have Social Security as a significant source of their total income, and I also conclude it’s a Lot of Effort to figure out if you can save perhaps $500 in taxes. And it’s easy to flub this up.
== No? benefit if your income is “high” ==
If your income – other than RMD – is high enough, skipping RMD is not that of a much benefit. My estimate of “high enough income” is when other income – interest, dividends, other pension income, for example – exceeds you gross Social Security benefit.
As I described in this post, you are not avoiding paying a tax: you are deferring when you will record that taxable income and pay tax on it. I used to think I would always come out ahead by deferring taxable income, but that is not an obvious truth for us retirees.
The problem for us retirees is that deferring taxable income may result in more tax later. This is because the underlying math of RMD consistently pushes you toward tripwires of higher Medicare Premiums –deducted from your gross Social Security benefit – and toward the next, higher marginal tax bracket. Over a decade, it can be a mighty push. You’ve lost when you cross Medicare tripwires and cross into the next marginal tax bracket that you could otherwise avoid.
The push comes the fact that when you are in your early 80s, your RMD will likely be double your initial RMD: at average market returns your portfolio will grow substantially even though you are withdrawing RMD; and you’ll pay a much greater RMD percentage a decade from now. And if it’s two of you now and one dies, that next Medicare tripwire and marginal tax bracket will be half the distance they are now.
== The benefit is at “lower” income ==
If you have somewhat modest income other than Social Security you may save on taxes by skipping RMD this year. You can permanently avoid paying taxes that you would otherwise pay. You could keep your total Taxable Income low enough such that you are in the 0% tax bracket for capital gains taxes. Unfortunately, I calculate that the practical benefit for my example tax payer is in the range of only $500. And it ain’t easy to figure out to avoid making an error to get that $500.
== You need a spreadsheet ==
The math for your actual tax benefit isn’t straightforward. I enclose this spreadsheet for a single filer to illustrate the potential benefit. The benefit is that the Capital Gains tax rate is 0% if your total Taxable Income is less than $40,000. You may be able to sell more taxable securities this year that are taxed at 0% Capital Gains tax rate – and thereby avoid 15% tax in a future year. The complexity is because but the recorded capital gain increases the percentage of your Social Security taxed at Ordinary rates. Taxes go up. Whew!
I can only explain this by walking through an example.
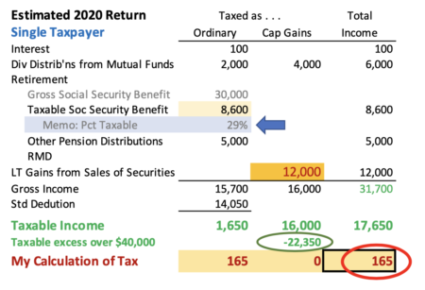
Our taxpayer, Barbara, is single and 74. She will record the following income on her 2020 tax return: $30,000 gross Social Security benefit, $5,000 from a Defined Benefit Pension Plan; and she estimates $6,100 from interest and dividend distributions from her taxable mutual funds.
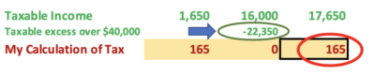
Barbara calculates her Safe Spending Amount (SSA) (Chapter 2, Nest Egg Care.) as $40,000 for the upcoming year. That’s the gross amount – before taxes – that she will withdraw from her nest egg this December. Barbara decides not take RMD this year. She will get the $40,000 from sale securities in her taxable investment account; I assume she records $12,000 capital gain on that sale. The result is total tax of $165 for the year. She will pay $165 tax on Ordinary income and 0% tax on the capital gain. 29% of her Social Security benefit is taxable.
$165 total tax when Barbara sells $40,000 of taxable securities for her SSA.
====
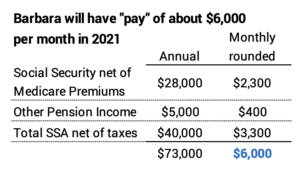
(Note: Barbara’s total cash for spending that is routinely added to her checking account for the upcoming year is about $73,000 or about $6,000 per month.)
====
Barbara is about $22,000 below the $40,000 level of Taxable Income where capital gains are taxed at 15%. The next increments of capital gain are taxed at 0%, but each increment also increases the percentage and amount of Social Security that is Taxable Income: more capital gains at 0% tax means more taxable Social Security and Ordinary Income tax.
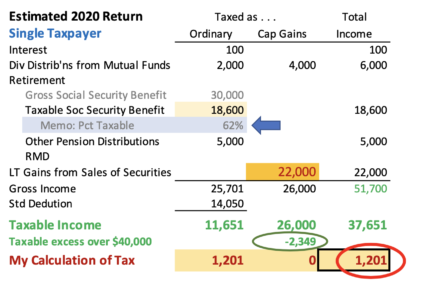
Let’s just assume Barbara sells more Taxable Securities, but then invests the proceeds the same day in a somewhat similar Mutual Fund. Her proceeds become the new cost basis of this mutual fund. I’ll assume the sale results in added $10,000 in capital gains income.
In a normal year – with the added ordinary income from RMD – that would all be taxed in at 15% ($1,500 tax) but it’s 0% tax this year. What is the effect on total income tax? 62% of her Social Security benefit is taxable now. Barbara pays a total of $1,200 in tax. That’s $1,035 more in tax and is effectively 10% of the added capital gains she recorded.
Barbara pays ~$1,200 in tax – roughly $1,000 more – if she sells more securites that result in $10,000 more in capital gain.
What’s the conclusion:
• Barbara can permanently avoid paying $500 of capital gains tax.
• This year she pays an effective capital gains tax rate of 10% not 15%. She pays $1,000 more in tax this year, but she will avoid paying $1,500 in a future year.
• The $1,000 she pays this year lowers her net from her SSA by $90 per month. Next year she will have $125 more per month.
Barbara is still a few $1000s below the $40,000 in Total Taxable Income for 0% tax on capital gains. You can play with the spreadsheet, but she has room for only about $1,000 more in capital gains. Beyond that she is paying 15% tax on the added capital gains and also driving up the percentage of Social Security benefits that is taxed: that’s not a good move. It’s easy to flub this up.
Conclusion: This post examines who can really save on taxes – totally avoid paying taxes – by not taking RMD this year. You can save if Social Security is a big portion of your income other than RMD. The benefit comes from selling more taxable securities and recording more capital gains that would be taxed at 0%. The practical benefit is less than this, since more capital gains taxed at 0% increases the percentage of Social Security benefit that is taxed. I provide a spreadsheet that a single tax payer could use to calculate the benefit. This is a bit of work – a lot of work, I think – to figure out how to save, perhaps, $500. It’s also easy to flub this up.
One of the three key decisions in your financial retirement plan is your choice of mix of stocks and bonds. In Nest Egg Care (NEC) I assumed you’d keep that same mix throughout your retirement. Now that I am older – I’ll hit 76 soon enough – I’ve been thinking: should I change my mix? You can find conventional wisdom that says you should increase the percentage of bonds as you get older. Do you buy that? This post gives my thinking on my choice of mix over time. My conclusion is that I will not change the mix I selected at the start of our plan. I won’t revisit this issue until I’m in my 80s.
== Mix is not THE key decision ==
The basic risk I want to avoid in the future can be expressed this way: DON’T RUN OUT OF MONEY. That means Patti and I want to spend what we can in retirement knowing that we will NEVER DEPLETE OUR PORTFOLIO. We look way out on the shaft of the hockey stick – at least 15 years in the future. We do not look at the roller coaster of ups and downs in the value of our portfolio month-by-month or year-by-year: we are not focused on minimizing ups and downs.
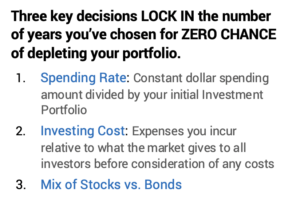
The shaft of the stick is the number of years for ZERO CHANCE of depleting your portfolio. You LOCK IN those years with three key decisions.
What we choose to spend – withdraw from our Investment Portfolio for spending each year – is THE KEY decision as to safety of our plan. The second key decision is Investing Cost and I’ve chosen really low Investing Cost: we reliably get to keep nearly 100% of what the market gives to all investors. Our decision on mix of stocks is the third decision, and it is the least important decision in terms of impact on the number of years for ZERO CHANCE of depleting our portfolio: I really control risk – the shaft length of our hockey stick – from the first two decisions, and my choice of 85% stocks – factoring in its effect to slightly lower our Safe Spending Rate (SSR%) – isno less risky than a choice of 75% stocks or 65% stocks or 50% stocks.
== Should I change as I get older? ==
The conventional wisdom is that you should shift your mix to more bonds as you get older. Some shifting may make sense, but a broad-brush change makes little sense to me.
I think the key question is, “Who (or whom) am I investing for?” as we get older. We all need to think about three: 1) you and your spouse – or the one who is still alive; 2) your children, grandchildren or other family members; 3) charities you want to support.
== Investing for you ==
As time rolls by, I’m less and less concerned about not having enough money for Patti and me and especially for just one of us when one dies: our Safe Spending Amount (SSA, Chapter 2, NEC) is now 20% more than it was at the start of our plan, and we were happy with what we could spend then. We’re convinced that one will spend less in total than two. And we have more portfolio value – measured in real spending power – despite withdrawing an average of about 5% per year for the last six years. You’ve experienced the same: you have more in real spending power than you ever did in your life.
And I know the lever to pull if I want greater safety or just a greater sense of safety: spend less than our calculated SSA. When we want to lengthen the shaft of our hockey stick – more years of ZERO CHANCE for depletion – we just spend a little bit less. We don’t need to fiddle with the mix of stocks. I conclude I have no real reason to lower our mix of stocks.
== Investing for your children==
Part of what you have will go to your children, grandchildren or other family members. Here’s how I think about that.
They’re younger. Some are lots younger. They’re not going to be going on a wild spending spree with the money that they will get from us. That’s just not in their nature, and we’ve given and will give them money that will allow them to spend to Enjoy More Now. They may decide to spend some of the money they inherit, but that will mean they will able to put more of their money into their retirement plans. That’s what I would encourage them to do, and that would be the same as if our money went into their retirement plans.
This money has a very long holding-period – the time one holds securities before they’re sold for spending. I’d guess it’s 20 years on average. If I gave money to someone money that they’d invest for 20 years before they spent any of it, how would I tell them to invest it? I’d tell them to read this post and this one, but the bottom line is that money today has to be invested 100% in stocks. And in simple index funds like the ones Patti and I use. Patti and I really are holding money for them that now has to be 100% invested in stocks. More bonds in our portfolio now makes zero sense.
== Investing for charities ==
Patti and I plan on leaving money to charities from our Traditional IRAs. That’s money that will never be taxed. We didn’t pay tax when we contributed and no tax will be due when it is donated at death.
(Patti and I view our Traditional IRAs as about the worst money to leave to our heirs. Pennsylvania takes about 5% off the top for state inheritance tax, and then heirs may be subject to high marginal tax in the future. In effect, we’re paying too much tax when we leave our IRAs to our heirs. When I’m dead I clearly won’t be bugged about paying those taxes, but it bugs me when I think about it now.)
I might consider increasing our mix of bonds for the money that I think will flow to charities. They have a very short holding-period once they get our money. They will be spending it almost immediately. I’d follow the logic of an appropriate mix of stocks for a short holding-period that I describe in this same post.
But should I lower our stock mix now? No, because I think and hope that Patti and I have many good years before we – or one of us – has to look at our mix of stocks in our IRAs that will go to charities. Patti’s life expectancy is 15 years. That’s a long holding-period. This is something to think about once we hit our 80s.
Conclusion: Should I be thinking that I should increase my mix to have more bonds as I get older? I conclude that I’m happy with the mix I chose for Patti and me at the start of our plan. I see no logic to change now.
1) More bonds do not increase the safety of our plan: the lever to increase the safety of our plan is to spend slightly less.
2) More bonds do make zero sense if I think about our heirs: that money should be 100% in stocks, since the holding-period is very long.
3) More bonds do make sense for the money we will leave to charities when we are nearer to the end of our trail: they get it and spend it, and therefore this money has the shortest holding-period. But Patti’s life expectancy is 15 years. That’s still a long holding-period. Changing our mix now for more bonds makes no sense.
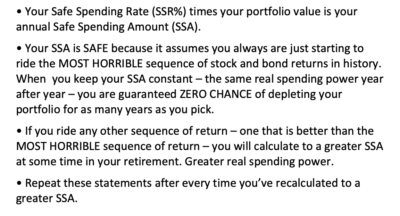
We nest-eggers always are spending – withdrawing for from our investment portfolio for spending – at a rate that equates to many years of ZERO CHANCE of depleting our portfolio. We always set a low spending rate because we assume that we always are facing the Most Horrible sequence of financial returns ever. It’s unlikely that we’ll experience the Most Horrible, but we clearly may face periods of poor returns. The purpose of this post is to answer two questions: What return rate on my portfolio will lead to a real increase in our Safe Spending Amount (SSA) in five years? And, roughly, what is the chance that we’ll experience returns at least as good that?
My answer is that Patti and I need about 10% real return on our portfolio over five years to result in a real increase in our SSA – an average of 2% return per year, and that’s less than one-third the expected return rate for our portfolio. It’s about 75% probable that we’ll earn at least that 10% over five years. That 10% return and 75% probability also apply to you assuming you follow the recommendations as to how to invest in Nest Egg Care.
== Why these questions ==
Patti and I are very happy with our monthly cash inflow to our checking account each month. Our SSA is +20% more than it was at the start of our plan. In a typical year – and clearly in a year like this where our spending on Fun Experiences is non-existent – we don’t spend our annual cash inflow to our checking account. We wind up giving the excess to our family or we donate more to charities.
Patti asked a couple of weeks ago, “How will I fare in the future when you’re not here?” (“Not here” means I’m dead!) I pointed out that she’ll lose my Social Security, for example, but the key thing that she WILL NOT LOSE is the amount that’s safe to withdraw each year from our portfolio.
Last week’s post said, “You will NEVER have a lower Safe Spending Amount than the one we have today; it will at least adjust for inflation, just like Social Security. The good news is that if returns match their long-run average, you can expect a 15% real increase every four or so years. Your total monthly pay will only get better. That’s +15% in four; +30% in eight; +50% in 12.
But I also wanted to give a different perspective. I wanted to find what kind of returns over five years would result in AT LEAST some real increase in our SSA – Patti’s SSA when I’m not here.
== The chance of an increase approaches 100% ==
If I’ve done my job to explain how your SSA is calculated, you’ll understand that it is almost certain that you’ll calculate to a real increase in your SSA sometime during your retirement. You pick the number of years you want for ZERO CHANCE of depleting your portfolio. The only time you do NOT calculate to an increase in your SSA for those years is if you ride the MOST HORRIBLE sequence of returns in history. You’ll calculate a real increase in your SSA for all other sequences of return.
You may find that you’re are not riding the MOST HORRIBLE sequence of returns quickly. You may calculate to a real increase after your first year, or you may calculate to a real increase just one year before your final ZERO CHANCE year. The probability of calculating to some real increase is lowest at the end of year #1, and it increases to almost 100% when you near the years you chose.
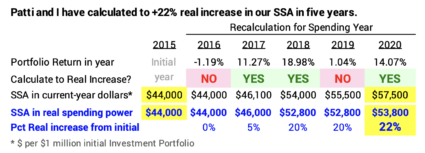
(Patti and I calculated to our first increase at the end of year #2, and we’ve calculated two more after that. Our total increase is +22% in real spending power. This is our calculation sheet from December 2019. The image is a brief summary.)
== The math ==
The math for the calculation to find what we have to earn for some real increase in our SSA in five years follows the same logic as last week’s post. We always calculate to a real increase in our SSA when we earn back in a year (or years) all that we’ve withdrawn for our spending – our total SSA withdrawn. We actually get a break on this: as we age, our Safe Spending Rate (SSR%) that we use for this calculation increases: we don’t quite have to earn back all we’ve withdrawn; we need less portfolio value for the same real SSA. We have to earn back less as the years pass.
== Our SSA will increase from 10% return ==
I calculate that Patti and I will calculate to some real increase in our SSA if we earn a shade more than 10% total on our portfolio over five years – 2% average annual return. That’s less than one-third the expected return on our portfolio.
This 10% return basically applies to you no matter your age. This is the same logic as I mentioned week. Younger folks with a lower initial SSR% will withdraw less over five years, but they get a modest benefit from increasing SSR%. Older folks – like Patti and me – start with a higher initial SSR% and withdraw more, but they get a bigger benefit from increasing SSR%.
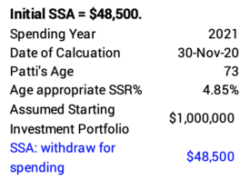
I’ve got to walk through steps to get to the 10% total return. My first step is to get the picture of our SSA in the first year. This assumes a starting Investment Portfolio of $1 million and uses the SSR% appropriate for Patti’s age this year. That’s $48,500.
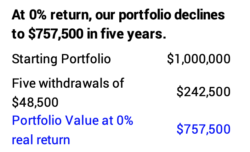
I use constant dollars – dollars in the same real spending power – for these calculations. With no real increase in SSA, the total withdrawn in the next five years would be $242,500. At 0% return over those years, that would deplete our Investment Portfolio to $757,500.
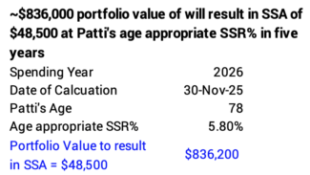
What portfolio value do I need in five years to calculate to an increase from the $48,500 SSA? I need to have a shade more than $836,200. The $836,200 is the break-even SSA of $48,500 divided by Patti’s age appropriate SSR% five years from now – 5.80%.
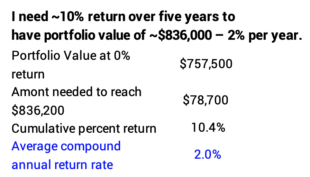
The last step is to find what cumulative return calculates to $836,200. I need a cumulative return of 10.4%: $78,700 on the $757,500 we would have at 0% return. This is 2.0% compound average annual return. The 2% annual return is less than one-third the expected 6.5% real return rate on our portfolio.
== We have 75% probability of increase ==
I conclude that it’s about 75% probable that our SSA will increase in spending power in five years. The converse is that it is 25% probable that five-year returns are not good enough to calculate to a real return in our SSA in five years.
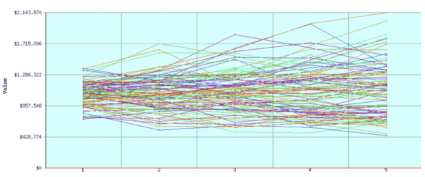
How do I get this 75% probability? I conclude this by looking at a graph of five-year returns from FIRECalc. I set FIRECalc to run all historical five-years return using a withdrawal of $48,500 per $1 million starting portfolio. I get a display of 90 five-year return periods or our mix of stocks and bonds. (I set the years to display as 1926 to present). Then, as best I can, I count those that are below the end point of $836,200 (~20) and therefore I know the number greater (~70). That means 70/90 or 78% of five-year returns will calculate to a real increase in our SSA for 2021 spending. Let’s call that 75% probability.
Thumbnail display of FIRECalc results: annual portfolio values for 90 five-year sequences of return.
Conclusion: I found in this post that Patti and I will calculate to some increase in our annual Safe Spending Amount (SSA) in five years if we earn a bit more than 10% real return over five years: that’s an average of 2% per year – less than one-third our expected return rate for our portfolio. I also estimated that it’s 75% probable that we’ll earn at least 10%. I combine last week’s post. I have this sheet attached to our refrigerator now. It says:
The Safe Spending Amount (SSA), the amount that we will pay ourselves – or you will pay yourself if I’m not around – will NEVER be less than it is today. It retains its same spending power over time, because it adjusts for inflation just like Social Security.
This is a guarantee for the years equalt to your expected lifetime – the nest 15 years to your age 88 and my age 91.
Our SSA almost certainly will be better – we’ll be albe to increase it to more spending power.
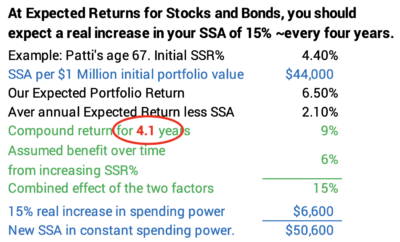
If returns match their long-term average return rates – we can expect a 15% real increase in our SSA every four or so years. That’s 15% more spending power in four; +30% in eight; and +50% in 12.
Even if returns are not that good – just one-third of what we should expect for our portfolio – we have a good chance to calculate to some real increase in our SSA every five years.
We’ve planned for the worst, but it is most likely that our ability to spend – your ability to spend if I’m not around –will be much better in the future.
Let’s assume you’re just starting your retirement. Following the steps in Nest Egg Care (NEC), you calculate your first Safe Spending Amount (SSA). (See Chapter 2, NEC.) That’s what you’ll withdraw right before the first of the year for your spending that year. That amount is the worst it will ever be because it assumes you are riding on the Most Horrible sequence of returns in history. Your SSA can only get better because it’s almost certain that you will not experience Most Horrible.
You wonder, though, “When might I expect it to get better? How many years might it take to calculate to a significantly greater SSA?” The purpose of this post is to answer the question, “At expected market returns, how many years would it take for my Safe Spending Amount to calculate to +15% increase in real spending power?” I show in this post, that you should expect to see a 15% real increase in your SSA roughly every four years. That’s +30% in eight years. +50% in 12.
This is an important question and answer. You want to plant in your head that you can expect a much better retirement – a significantly greater SSA – in NOT THAT MANY YEARS. If you’ve implemented your retirement plan following the recommendations in NEC, you have seen this over the past several years: your SSA has increased by +15%.
Fifteen percent more is a big deal. Patti and I were happy with our initial SSA, but when we reached the point of +15% greater SSA, I found a new sense of well-being and comfort. I knew that Patti and I will REALLY, REALLY NEVER RUN OUT OF MONEY. We knew that we had More-Than-Enough (See Chapter 10, NEC) and could think about how our money might best help others.
== Two factors drive increases in your SSA ==
The calculation that tells you if your SSA will increase in real spending power is driven by two factors. (See Chapters 2 and 9, NEC and this post that discusses our calculation in December 2017.) This discussion follows this sheet I use for our calculation of our SSA.
Factor 1. Your annual portfolio returns. Your portfolio return is driven by market returns for stocks and bonds and your mix of stocks vs. bonds. You calculate a greater real SSA every time your portfolio returns earn back more money than you had when you withdrew your SSA.
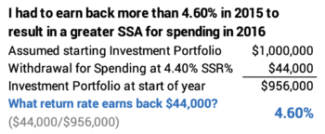
Example: I withdrew 4.40% from our Investment Portfolio at the start of our plan in December 2014. That was our Safe Spending Rate (SSR%) based on Patti’s age = 67. To put the 4.40% into dollars, let’s assume an initial $1 million Investment Portfolio. 4.40% translates to $44,000, our Safe Spending Amount (SSA). [You then use your Multiplier to get the actual dollar amount for your SSA. (See Chapter 1, NEC).] I sold securities to get our SSA into cash at the end of December for all our spending for 2015.
Here’s the simple math: I needed a real portfolio return greater than 4.60% in 2015 to earn back what I withdrew before the start of the year. If earned more than this I’d have more in real spending power at the end of 2015 than I had right before our first withdrawal in 2014. I would have More-Than-Enough for our current SSA, and I’d calculate to a real increase in SSA for the upcoming year.
The real return on our portfolio for 2015 was -1.2%. We clearly did not earn back what we withdrew. That math won’t work to calculate to a greater SSA.
I need to wait another year. Would returns be good enough to recalculate to a greater SSA then? The math works out that we had to earn back +11% real return in 2016. I had to make up for the December 2014 withdrawal, the decline in 2015, and the December 2015 withdrawal. I had to earn back more than $99,500 to exceed my starting $1 million.
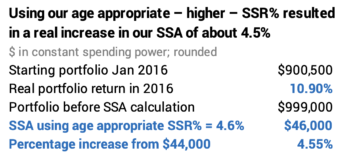
Returns for 2015 didn’t quite make it. Our portfolio return was 10.9% in 2016: just .1% short and to a total of $999,000 (rounded). We could not calculate to a real increase in SSA using our initial SSR% of 4.40%.
Factor 2. Your applicable Safe Spending Rate (SSR%) increases with age. This factor works in your favor in the calculation of your SSA. This factor means you really don’t have to earn back all that you withdraw for spending to calculate to a greater SSA.
Example: I really didn’t need to earn back to surpass or $1 million real portfolio value before increasing our SSA. That was because our applicable SSR% at the end of 2016 – since we were two years older and have a shorter life expectancy – increased to 4.60%. I applied 4.60% to our $999,000 and calculate to an SSA of ~$46,000. That is a ~4.5% real increase in our SSA and is solely due to this factor.
== How many years to +15% SSA? ==
I can calculate how many years it takes to earn back enough to generate a real increase of +15% in SSA. I make a few assumptions for the calculation below:
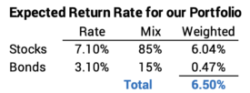
1) I used the expected return rates for stocks of 7.1% real return and bonds of 3.1% real return. You can see the source of these returns here.
2) I assume the portfolio mix that Patti and I use. That’s 85% stocks and 15% bonds: this translates at an expected return rate of 6.50%. (This would be 6.1% at a mix of 75%-25% and the final answer will be one year longer than I calculate.)
3) I assume the SSR% increases by 5% over the years. This is simplifies the calculation. (SSR% increased by ~10% for Patti and me in five years: from 4.40% to 4.85%.)
== It’s about four years =
The table below shows that takes about four years for a 15% increase in your SSA.
Admittedly this is a simplified calculation, but four years is about right for all ages at the start of your retirement plan. Patti’s age 67 at the start of our plan determined our SSR% = 4.40%. (See Graph 2-4 and Appendix D, NEC). Someone younger starts with a lower SSR%. The difference from expected portfolio returns is greater. But SSR% increases more slowly and that benefit is less.
Someone older would have a greater SSR%. The difference from expected annual returns is less. But the SSR% increases more rapidly and that benefit is greater.
Restated: you could expect a 15% real increase in your SSA about every four years! With typical returns, Patti and I should expect a 15% real increase in our SSA every four or so years. It’s increased by 22% in real spending power, but four years from now Patti and I should expect our SSA to grow in real spending power by another 15%. And another 15% in another four years after that and so on. Oh, boy! Just somewhat normal returns would be very good.
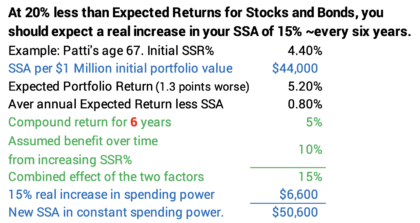
== Or maybe its six years ==
I calculate that it’s six years if returns are 20% worse than expected returns. That means lower return and compound growth in our portfolio over time. Because it’s going to be more years to calculate to 15%, I used 10% as the percentage increase in SSR%. That’s a pretty good assumption: Patti and I see a ~20% increase in our SSR% in eight years – from 4.40% to 5.30%.
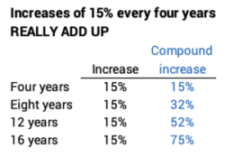
Conclusion: You should have a sense of optimism about your financial retirement plan. Odds are your Safe Spending Amount (SSA) will be much greater over time. I think you will feel much better about your financial retirement plan when you hit +15% real increase in your SSA. At expected real returns –long-run average returns – for stocks and bonds, you could expect a 15% real increase in your SSA every four years. That compounds from your start to 32% four years later. Then to +50% in another four years. Even if returns are somewhat substandard, you can expect 15% real increase in roughly every six years.
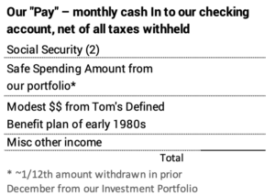
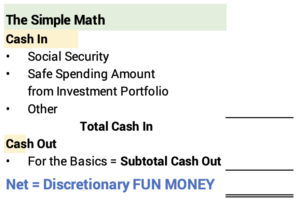
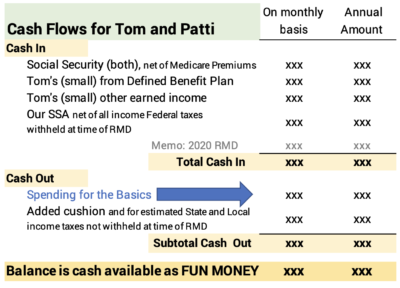
All we retirees – or soon-to-be retirees – have a burning question: Can our financial portfolio provide enough cash for spending for a Very Happy retirement – for the rest of our lives? You obviously need to add up the cash that rolls in every month: that’s basically Social Security + your Safe Spending Amount (SSA) from your investment portfolio [See Chapter 2, Nest Egg Care (NEC)]. You then need to know what you spend on the Basics, and, from subtraction, you know how much you have as Fun Money – the discretionary cash you can spend to ENJOY throughout your retirement. Nest Egg Care and this post answer the key questions on Cash Inflow each month. The purpose of this post is to provide a framework to answer the question, “How much cash do we need each month – or in the year – for what we consider as our Basic spending needs in retirement?”
I didn’t start my planning for retirement by estimating what we needed for our Basic spending. I was already retired. Patti was getting there. We were spending from our investment account when we needed to. Our portfolio wasn’t sinking, so I thought we were Okay. But I did not know where we stood with any confidence. That’s why I dove in to find our Safe Spending Amount (SSA), the amount we could pay ourselves from our financial portfolio throughout our retirement.
Our SSA, added to Social Security and some other income we have, was more was more than we were spending, and we weren’t skimping on travel at the time. I therefore knew we were better than Okay – that’s a nice position to be in – but I never went back and figured out what we spend for the Basics.
Patti asked last week, though, “What happens if you die? I’ll lose your Social Security (SS) check. You have a small monthly check from an ancient defined benefit plan; what happens to that? And you have some other income that I won’t get. Paint a picture for me: how much do we spend per month or year on what we might consider as the Basics, and how much discretionary income will I have above that?”
I could easily see what would happen to her monthly Cash In if I’m not around: the biggest impact is the loss of my SS check. But I had no monthly or annual number for the Basics. I could not tell her, “Here is the cushion – the Fun Money – you have each month that’s more than your spending on the Basics.” I had to first understand our spending for the Basics.
I need to find how much we spend on the Basics
== The mechanics ==
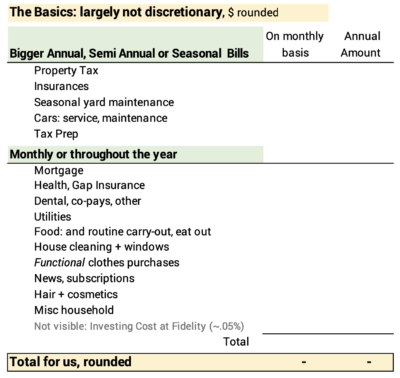
I used this spreadsheet to list all our Basic spending. The hard part was remembering the infrequently used vendors I should include. I kept adding more as I thought about them: Steven for the window washing; AJ for planting annual flowers; sporadic vet bills for Dudley over a year.
General format of my spreadsheet to add to the Basics.
Once I had all the vendors or expenses listed, it was easy to get an accurate picture of the amount we spend in a month or year. My spreadsheet has a column for average monthly expenses and a column for total annual expenses. I either entered monthly expenses and multiplied by 12 or I entered annual expenses and divided by 12.
Monthly expenses that don’t change are easy to see on our credit card (The cable bill is charged to our credit card.) or as ACH debits on our bank statement (The cell phone bill is the prime example.) I have all our checks and ACH transactions in Quicken. I can easily get the total paid for the prior 12 months to all other vendors. I manually added up all food related expenses on our last three credit card statements to get a good picture of how much we spend on food per month.
== Our Basics are A LOT ==
What I consider as the Basics for us are A LOT MORE that I would have estimated off the top of my head. Our total is more than we spent we before retired. The big reason is that we have a bigger mortgage now; I took money from our non-financial asset – home equity – to get more money in our taxable investment account. That’s added cash I got with no tax cost. The second reason is that our home now is smaller but nicer and more expensive to maintain. I’m Okay with our Basics being more than I thought, since our Safe Spending Amount is well above our basics.
Four items add to almost two-thirds our total spending for the Basics.
• Mortgage P+I. We have a mortgage, and I include the Cash Out as part of our spending on the Basics. It’s by far our #1 use of cash. It’s Cash Out every month and we need Cash In every month to pay it. We basically get that monthly Cash In from our monthly pay out of our annual SSA.
But I don’t really consider our mortgage payment as a real cost. In essence, the dollars equal to the mortgage principal reside in our investment account. I view that Patti and I are going to earn roughly 6% real return per year – averaged over enough years – on that money. We pay roughly 1% real cost per year (3% interest less ~2% inflation). We’re five percentage points better off per year on the outstanding loan balance.
Looking at this differently, we could take cash from our investment account and pay off the mortgage to lower monthly spending on the Basics, but we choose not to.
• Food. I estimate we spend $550 per person per month. Everything we spend on food is on our credit card, and that was the average for the last three months. This is more than I thought. The total may be distorted some by the wildly high tips I leave for carry-out during this time of the Coronavirus. Those folks deserve our help.
• Property Taxes are high here. PA has about the tenth highest rate of property taxes in the US and Pittsburgh property taxes are well above the average in PA. Most of property taxes goes to schools, and spending per student for Pittsburgh public schools is among the highest in the US.
I hate paying property taxes. I’ve mentioned this before. Every year I consider just paying them with our HELOC, but I don’t. Paying them out of our SSA pains me: I keep thinking about the opportunity cost. What would we like better? Paying these taxes or being on a trip in Europe for two weeks? If we get in a pinch, or if Patti feels she is in a pinch when I am gone, I’ll use/she’ll use our HELOC for this outlay.
• Yard maintenance is a big expense for us. It’s WAY MORE than we used to spend before we moved about 13 years ago. I don’t think our yard as that big, but it takes a lot of care to keep it looking good. It generally looks fantastic. We could shave some cost, but we both want to keep our house and yard looking great. I think what we pay is on the order of what one might pay as a fee to a condo association, though, for annual upkeep of grounds and common areas.
I don’t budget for the cash that would be needed to replace our cars. That would be a big expense if I included it. We drive hardly drive our cars now. We both think it is silly to think of replacing them as part of the Basics. That spending will have to come out of our discretionary Fun Money. I’ll be reluctant to spend. I’ll think: do I want to spend this money on a new car or would I rather take two or three trips with Patti to Europe?
As I look over all these items, I conclude the two of us can’t reduce our Basics by more than a few percentage points.
== Patti alone would spend less ==
If I were not around, I calculate that the Basics for Patti would be about $1,000 per month less: food is the big expense saved; she’d sell my car and net enough to pay her car expenses for a decade. She lower Cash Out by a hefty amount if she chose to pay the property taxes with our HELOC.
Conclusion: At the start of your retirement – or just to be clearer if you are retired – you should have a good handle of how much cash you spend on a monthly and annual basis for the Basics. This post gives you a spreadsheet that I used. I found that our spending for the Basics is much more than I would have guessed without adding them up. But when I subtracted our spending on the Basics from our total monthly Cash Inflow, I still find Patti and I have enough discretionary Fun Money for the rest of our lives. That conclusion holds if only one of us is around.
This is the month Patti and I think about who (whom would be more correct!) we will donate to before the end of the year and how much we will donate. I spent more time thinking about our giving this year. Giving money away is Hard Work! It’s an Uncomfortable task. But it makes us happy that we can do this. The purpose of this post is to describe how we think about our donations. I provide two excellent web sites that have helped us figure this out. I’ve discussed this topic before, here, here and here.
== How much spending makes us happy? ==
We’ve been following our retirement plan for six years now. This December will be the seventh year we sell securities for our spending for the upcoming year. We clearly know how much spending makes us happy. We know we have enough in our stockpile – financial and non-financial assets we can tap – to carry us through the worst storm of personal health crises.
After six years of experience, we know the amount that we want spend to on ourselves that makes us happy. We are perfectly happy with our initial 2015 Safe Spending Amount (SSA) of $44,000 per initial $1 million Investment Portfolio. We use our Multiplier to get to our yearly total. (See Chapters 1 and 2, Nest Egg Care [NEC]).
Even in the first year we found we did not spend all that we have paid ourselves throughout the year. Every October or November Patti and I need to figure whom we will gift or donate to and how much. We spend, gift or donate our total SSA each year.
== We have More-Than-Enough? ==
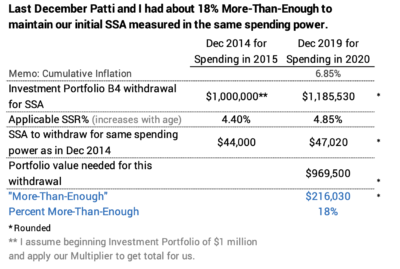
Last December our SSA calculated to $57,500. You can see this on our calculation sheet that I’ve annotated. This includes the effect of about 7% cumulative inflation. When I remove inflation, we pay ourselves $53,800 in dollars with the same spending power of December 2014 – constant 2014 dollars. That’s 22% more in real spending power.
If we decided to pay ourselves our original $44,000 in the same spending power, we’d set our SSA to $47,020. That’s $44,000 adjusted for the 7% accumulated inflation over five years. The math works out that our portfolio, before our last withdrawal for spending, was about ~18% More-Than-Enough to support our original $44,000 spending level. (See Chapter 5, NEC.) And if returns hold for this year, we’ll will have a greater amount of More-Than-Enough: so far the real return on our portfolio exceed the 4.85% we withdrew last December.)
18% More Than Enough! That means if we take that 18% and gift or donate it now, we have a portfolio that fully supports the same real SSA we had at the start of our plan. And we’d still have potential for future increases in our SSA. And we’d still have a ~60% chance that the spending power of our portfolio would continue to grow and be greater at death than now (See Chapter 2, NEC).
If you’ve been a nest egger for just several years, you are in the same boat: your SSA has increased; you may have a good handle on what spending makes you happy; if it’s less than your current SSA, you also have More-Than-Enough.
== Decision to donate ==
The focus on this post is on donations to charity. Patti and I know we have and will gift a proper amount to our family. That’s not an issue. But figuring out who to donate to is hard and uncomfortable work! It’s much easier not to donate or to donate modestly – amounts that are almost meaningless to our financial well-being. It’s much easier to name amounts for charities as beneficiaries of our IRAs or in our wills; we don’t have to give them that much thought now; and we can always change our wills down the road. It’s also easier to pass the money on to our family and let them make these decisions in the future. If we did the easy things, we wouldn’t have to think about a theme for our giving or to sort through which organizations are best.
== Theme: avoid preventable deaths and suffering ==
We like having a theme or central focus for our giving. We want most all our charitable giving to be used to avoid preventable deaths and suffering – especially of children. That’s our major theme. It gives us focus. Having a theme also makes it easier to say no to some charities that do not fit. I estimated in this post that roughly 60% of our giving went to this theme in 2019.
== Which charities ==
It is very difficult to judge the best way to donate for our theme. I find two web sites invaluable. They rank the impact of giving and the effectiveness of organizations.
• GiveWell: “The gold standard for giving.” (Quote from The Boston Globe.)
• The Life You Can Save: Effective charities do more with your donation. (I think this terrific web site is new in 2020.)
• (The Mulago Foundation is a private foundation that directly supports 52 programs and charities it thinks are exceptional; four are on a list of the two above.)
I list and sort all the charities from the first two on this sheet that you can print. The lists overlap. In general, GiveWell applies a stricter methodology to evaluate programs and organizational effectiveness than The Life You Can Save. This week I read the profiles of all the charities on the two lists. We contacted the ones we’ve given to in the past to get an update of efforts and progress.
We picked four top charities to support in 2020. They will receive 75% of the total that we will donate this year:
1. Doctors Without Borders. Lifesaving, humanitarian healthcare and advocacy for refugees and healthcare. It does not make the lists at GiveWell or The Life You Can Save. Their work does not lend itself to Randomized Control Trials (RCTs) that both, especially GiveWell, use to judge impact. Patti and I visited them in New York last year. We’re impressed with what they do.
2. GiveWell. We give to GiveWell and ask them to allocate our gift to their topmost charity: the one that has the biggest impact for dollar given. The top priority can change, but all of our donation has gone to the Malaria Consortium (MC) for the past few years. MC provides pills to mothers give to their young children to prevent malaria for the five-month rainy season in Africa. GiveWell estimates that ~$2,500 translates to one life saved.
3. Oxfam America. Oxfam is on the list of The Life You Can Save, but isn’t on GiveWell ‘s list. Oxfam’s work is not going to lend itself to RCTs. Oxfam is a not bottoms-up program where relatively small spending can affect a single family: a goat or cow or a small monthly dollar allotment for a family would be examples. Oxfam focuses on giving voice to the poor to advocate for policies that improve the lives of millions. Ghana changed a policy to direct 15% of all oil revenues to lift 18 million impoverished farmers out of poverty. We visited Oxfam in Boston two years ago and went to Puerto Rico to see their efforts to help following Hurricane Maria. We like what Oxfam does.
4. Our local United Way (UW) has selected agencies they judge as highest performing in our county. These agencies are supported by donations directly to United Way and its Impact Fund. In this year of COVID-19, Patti and I want to particularly support UW’s Emergency Basic Needs Program (EBNP). The EBNP provides modest financial support to those who fall in the cracks of federal assistance programs. We want our money to be spent by those who need it most. This clearly is not the same level of death, suffering and poverty addressed by the three above, but this is THE YEAR for us to step up to added support for this program.
Conclusion: Giving money away can be a source of happiness, but I find it is Hard and Somewhat Uncomfortable Work to pick a theme for giving and to find charities – programs and organizations – that will be most effective with the money we donate. We haven’t changed our spending habits in six years. We’ve accumulated in our portfolio More-Than-Enough for a spending level that will make us happy. Our plan this year is to donate more than we have in the past.
Patti and I decided on a theme for our giving: avoiding preventable death and suffering. I use two web sites that highlight some of the most effective charities. We picked four key charities this year. We think these donations will make us happy.
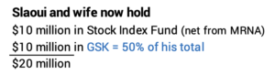
I read this article, “Trump’s Vaccine Czar Refuses to Give Up Stock in Drug Company involved in his Government Role”. The top scientist for Operation Warp Speed, Moncef Slaoui, was hired as a contractor, not as an employee, to avoid the ethics requirement that he sell stock holdings in a company that could benefit from his work. He said he didn’t want to sell his shares in GlaxoSmithKline (GSK) “because that’s my retirement.” This was $10 million in addition to $12 million stock he held in Moderna (MRNA) that he did agree to sell. What thought went into the decision not to sell GSK? Let’s forget the ethical issue about owning GSK: the purpose of this post is to look at what I think is faulty thinking – or perhaps not thinking at all – about a financial retirement plan.
Admittedly, $20 million or so is a VERY BIG net worth. It’s obviously hard to relate to, but I think the correct thinking Slaoui should have used would apply to any retirement portfolio: if I were Slaoui, I’d sell GSK in an instant.
== 50% of your nest egg in one stock? ==
I’m sure I’m simplifying: I assume that Slaouis’ financial retirement plan starts now with total financial assets of $20 million. I’ll assume he netted $10 million on the sale of MRNA, and I’ll assume he put the net in a diversified index fund like FSKAX (I own), VTSAX or in an ETF such as VTI or ITOT. Terrific. But now he has $10 million in one stock. This would make GSK half of his financial next egg.
Would you hold 50% of your nest egg – or anything close to that – in one stock if you were thinking about a retirement? No! I realize the thought of paying taxes on gains far earlier than you otherwise would over the rest of your retirement plan would make your brain hurt. But that much in one stock means you’ve lost predictive power for your future financial returns, and that’s a Very Expensive loss in my mind.
You have predictive power – based on historical returns – when you own an index fund or ETF that reliably mirrors market returns. You lose predictive power from holding too much in one or several stocks. Will that one stock match, beat or underperform total market returns? You really don’t know. Keeping it adds too much uncertainty to your financial retirement plan. You never want to add uncertainty. You can’t trust any calculation of your Safe Spending Rate (SSR%). You can’t judge that your resulting annual Safe Spending Amount (SSA) is truly safe.
== A stock with lousy historical performance ==
The stock Slaoui will not sell is GlaxoSmithKline (GSK). GSK’s total return – the effect of stock price + dividends reinvested – lags the market – represented by a total market index fund – by about NINE percentage points per year. NINE! It’s lagged consistently over the last 10 years. This is SERIOUS under-performance. The worst stock mutual fund I can find – MUHLX, which ranks at the very bottom of all its peer funds in ten-year performance – is better in return than GSK.
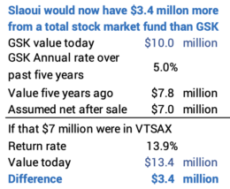
It’s not fair to use hindsight, but Slaoui would have $3.4 million more if he had sold his GSK five years ago. He has $10 million now, and I can work back in time using the return data to find he would have had about $7 million – net after taxes – five years ago. If he had then invested that $7 million in VTSAX, he’d have $13.4 million today. OUCH.
The past is a poor predictor of the future, but that poor performance makes it hard to conclude that GSK will match or outperform market in the future. If I were Slaoui, I’d sell it now. I’d have to override the discomfort of taking a tax hit now and selling well below it’s value at the start of year year. It’s the smart thing to do. This is very similar to the decision to hold onto a poor performing mutual fund or to sell it, pay taxes, net less, but grow with a market index fund. I describe that decision-process in this post.
== Is $45,000/month after taxes enough? ==
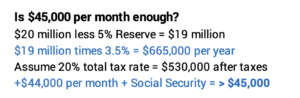
I’d bet Slaoui – or his financial advisor – didn’t spent five minutes thinking through how much $20 million delivers in terms of an annual Safe Spending Amount (SSA; see Chapter 2 Nest Egg Care [NEC]) for the balance of his and wife’s lives. In WORST CASE, starting now, his financial nest egg will deliver an annual SSA of $665,000 in today’s purchasing power for rest of their lives. Wow!
That’s pre-tax, so I’ll guess that is $530,000 after taxes that he and his wife have to spend or give away each year: that’s $44,000 per month. That doesn’t count the relatively small amount they’ll get from Social Security. The total is more than $45,000 per month. Can Slaoui possibly think that selling GSK – and paying tax on gains now – has a meaningful impact on his retirement?
I use 3.5% as the Safe Spending Rate (SSR%) for this calculation. I assume Slaoui and his wife start their retirement now. The article says she is 50 years old; her life expectancy is ~35 years. I only displayed SSR% up to 30 years in Graph 2-4 or the Appendix D Table in NEC. I use the same steps described in the text in Appendix D to find that that the SSR% for 35 years is 3.5%.
== Maybe it’s $90,000 – or more – per month ==
In a few years, their SSA will be almost certainly be more than $44,000 per month in real spending power. They’d start their plan now by withdrawing 3.5%. That’s less than 60% of the expected return on their portfolio – more than 6% – if they come anywhere close to the mix of stocks and bonds I recommend in NEC. It’s almost certain that they’ll earn back more than they take out in a year – or cumulatively in years – and they will calculate to a real increase SSA each time that happens. (See Chapter 9, NEC.)
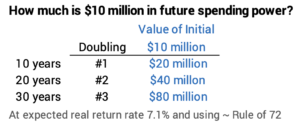
How much might their SSA increase? I showed in this post that SSA for Patti and me would double in 20 years if future returns were average. It would be more than that for Slaoui and his wife. They start at a lower SSR%; its easier for them to reach the point when they calculate to a greater SSA; and they have at least another decade for their money to compound than Patti and I did at the start of our plan. But let’s just use that 100% – double – real increase in spending power. That’s ~$90,000 per month.
== Why donate all gains in GSK? ==
Slaoui said he would agree to donate all his future gains from GSK? Why do that? This makes no financial sense. That’s means he accepts NO potential future growth on $12 million for his retirement. Stocks double in real spending power every ten years at expected returns. It he sold GSK, he could see the net $10 million grow to $40 million in 20 years. (That’s two doublings; he’d be 81.) Or $80 million in 30 years. (That’s three doublings; his wife would be 80.) Who put pencil to paper to that?
Conclusion: Most folks don’t think about how to get their portfolio in shape at the time they start retirement and don’t figure out how much they will be able to safely pay themselves in retirement. This post discusses a set of decisions that did not make sense to me. My advice is: 1) Don’t own too much in a security or securities that add unpredictability to your future returns relative to market returns. 2) Especially sell securities where you think they could perform less than the market as a whole, regardless of today’s tax consequences. 3) Decide how much monthly “pay” you need in retirement – how much you want to withdraw from your portfolio that – along with Social Security or other income – will make you happy in retirement; you may find your nest egg now or in the near future will give you a very happy amount.
The purpose of this post is to explain how Social Security (SS) calculates the Cost of Living Adjustment – COLA – each year. Your SS benefit increases by the percentage COLA to maintain the same spending power over time. I also use the percentage COLA to calculate how my Investment Portfolio (Chapter 1, Nest Egg Care) changed in terms of real spending power over the past year. We nest eggers need to do that to properly calculate our Safe Spending Amount (SSA) for the upcoming spending year (Chapters 2 and 9, Nest Egg Care [NEC]). Will our SSA just adjust for COLA or will it increase in real spending power?
I wondered a couple of things this week: Does SS’s COLA use the most common index of inflation? Does the COLA accurately reflect the spending patterns of retirees? How exactly does SS calculate COLA? Since they’ll announce the increase for 2021 in early October, what are we waiting for now for their calculation? How much might COLA be for 2021?
== CPI-W ==
The Bureau of Labor Statistics (BLS) monthly gathers measures of price changes for many components of consumer spending – 17 components in total. It then assembles indices of consumer spending based on spending patterns of different groups of consumers. You can see a recent calculation and the weights – relative importance – of the components for one index of inflation here. This BLS page shows monthly changes from January 2010 for the two most widely indices.
• The most common measure of inflation is CPI-U – the Consumer Price Index that reflects purchasing patterns of all Urban Consumers. “Urban” includes places of more than 2,500 residents, and the index covers the purchasing patterns of about 90% of the US population.
• By law, the SS COLA is calculated based on the annual change in CPI-W – the Consumer Price Index for Urban Wage Earners and Clerical Workers. This index reflects the slightly different spending habits of the population of wage earners relative to the all-urban consumer population. I don’t know the history of why CPI-W was selected rather than CPI-U. BLS assembled an experimental index specifically for folks over age 65 – CPI-E, and over the years, it’s increased by more than CPI-W. But the statute says SS must stick with CPI-W.
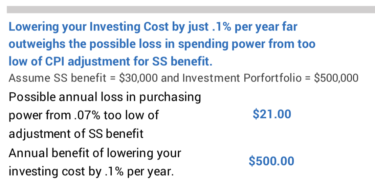
== CPI-W < CPI-U ==
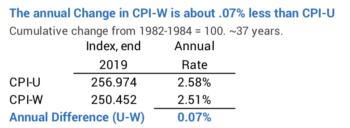
Inflation as measured by the CPI-W is slightly less than that measured by CPI-U. The BLS table shows that from the initial start date (the average over 1982-1984), the CPI-U accumulated to 256.974 at the end of 2019 while CPI-W accumulated to 250.452. The average compound rate of CPI-U has been 2.58% while it’s 2.51% for CPI-W – an average difference of .07 percentage point per year. That is a tiny difference the total dollar difference for those retirees with a nest egg. Folks with a nest egg will keep far more dollars of spending power if they lower their Investing Cost – the weighted expense ratio on the securities they own – by .1%; that’s pretty easy to do for most all investors.
== The calculation of COLA ==
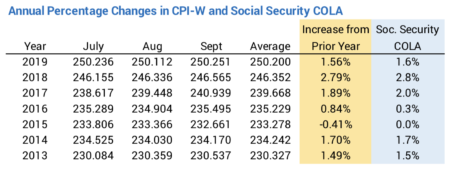
• The calculation of COLA averages the inflation indices for the third quarter of the year – July, August, and September – and compares that to the average for the same period of the prior year. This table shows the monthly values for CPI-W, the annual percentage change in CPI-W, and COLA for the last seven years.
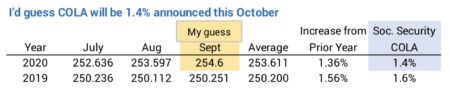
We are waiting for the September number for CPI-W to complete to get the average for this past quarter. BLS publishes a calendar and will announce September CPI on October 13 this year. SS will announce COLA shortly thereafter. When I plug in my guess for CPI for September, I get that COLA for 2021 will be 1.4%. A small change from the value I have for September would mean COLA would be 1.3%.
• COLA is rounded to the nearest one-tenth percent. COLA rounded up from CPI-W in 2018 and 2019, meaning that COLA over the two years was slightly greater than the increase of CPI-W over those two years. Over the years, the rounding up and rounding down will even out. COLA will closely track CPI-W.
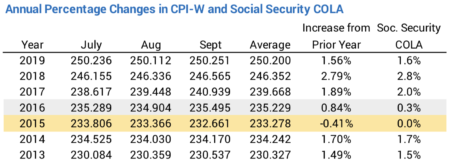
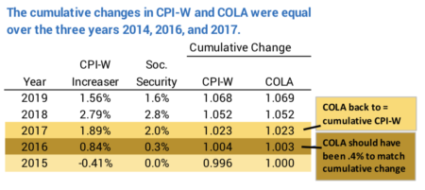
• COLA can never go below 0%. Your gross SS benefit never declines. The 12-month period ending September, 2015 was a period of deflation. $1 had greater spending power at the end of that period than at the beginning. To track perfectly with the change in spending power, COLA should have declined, but the COLA for that year was 0%.
You can see how SS accounted for that in the next two years. In 2016 CPI-W increased by .84% while COLA increased by .3%. The attempt is to keep cumulative COLA and CPI-W on track. My math shows that was not quite the correct math: the change in COLA should have been .4% in 2016 to equal the cumulative change for the two years. In 2017, however, COLA was 2.0% vs. the change in CPI-W of 1.9%. That COLA increase got the cumulative change of CPI-W and COLA back on track. I’m not sure why it took that extra year for COLA to track accurately.
Conclusion: Your gross Social Security benefits adjust for the effect of inflation to maintain the same real spending power of your benefit over time. (We nest eggers at least adjust our SSA for inflation each year for the same reason.) By statute, SS uses an inflation index CPI-W, which is slightly different than the most commonly used index, CPI-U. The calculation each year is based on the change in inflation for the third quarter of the year (July, August and September) from the same quarter of the prior year. COLA is rounded to the nearest .1%. Some years it rounds up and in others it rounds down. Over time it accurately tracks with CPI-W.