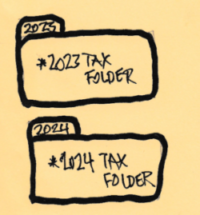
What? Should you be doing ANYTHING now related to your 2024 taxes? Yep. I set up the file folders on my computer that I’ll eventually fill up with documentation for my 2024. It sounds strange, but this is the time to do that. I found out the hard way: I spent too much time this week setting up my 2023 Tax Folder, and I don’t want to make the same mistake next year at this time. This post describes the simplifying task of setting up my 2024 Tax Folder.
== My 2023 tax folder ==
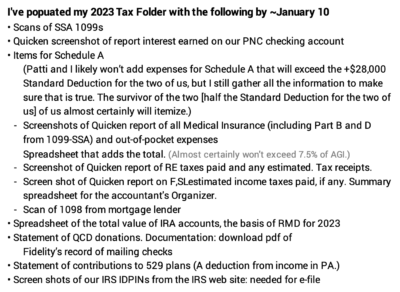
I show here the detail of the folders on my computer for our 2022 tax return. I’ve been populating it. I’ve completed about 70% of all that I’ll need to do for this year:
Then I remembered I needed to have the same set of folders for my 2023 tax return. I’ll populate that folder with copies of receipts for our real estate taxes in a month or so. That’s where it got messy:
• I manually made all new folders for my *2023 Tax Folder, but then I realized I did not have to do that. I wasted time.
• The trick or logical step to take was to duplicate the 2022 folder in its entirety. The result is “*2022 Tax Folder copy”: all the folders within that copy retain their name; they don’t have the word “copy” in their name. I would then rename the folder “2023 Tax Folder” and go through and delete the information that I put in the individual folders for 2022 taxes.
I should have renamed this folder as *2023 Tax Folder and then removed the items for 2022 taxes that clearly won’t apply for our 2023 return.
== My 2024 tax folder ==
Then I realized I could avoid this added work next year by duplicating my *2023 Tax Folder now – it has no documentation for 2023 taxes and rename that for 2024. I could even duplicate it again for my *2025 Tax Folder.
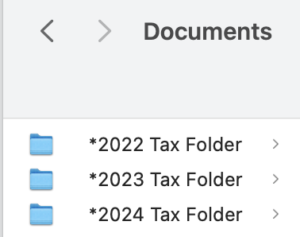
These are the top 3 folders that I see when I open Documents on my desktop.
Conclusion. My *2022 Tax Folder has about 20 folders or standard spreadsheet formats. I populate the folders and complete spreadsheets as I gather the information throughout the year and particularly in January for my tax preparer.
I created my “*2023 Tax Folder” creating all the folders that should be in it; this wasn’t the most efficient way to do this. I waste time. But I now have a complete and clean – unpopulated – “*2023 Tax Folder”. I then duplicated that folder and renamed it “*2024 Tax Folder”. I have no time or effort next year to create that folder.
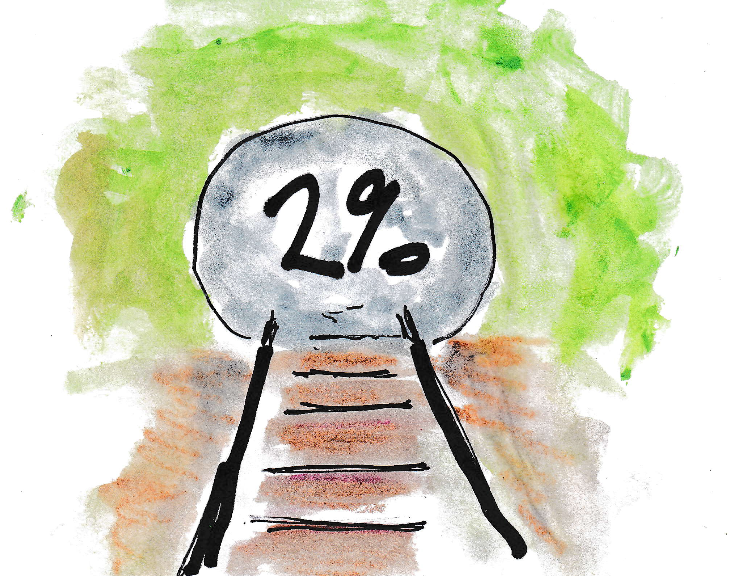
The inflation data for December came out on Thursday: we continue to track to less than an annual 3% rate of inflation, and 2% is in sight. I show several graphs that help me see the trends in inflation more easily. I think the two most important measures are Core Inflation (Inflation less volatile food and energy) and Personal Consumption Expenditures (PCE); this latter one is the favored measure of the Federal Reserve.
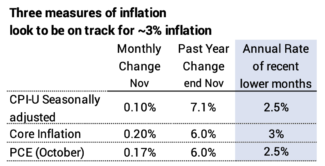
== Three measures of inflation ==
The two most widely-reported measures of inflation are Seasonally-adjusted inflation and Core inflation.
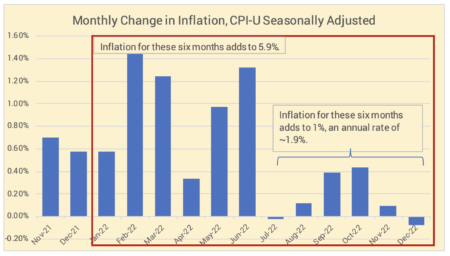
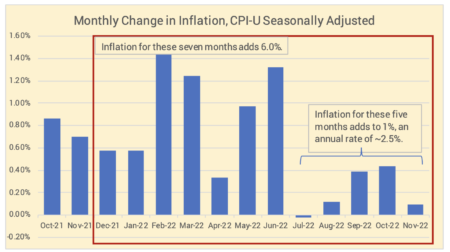
Seasonally-adjusted inflation declined -0.08% for December and has totaled to less than 1.0% over the last six months: that translates to an annual rate of ~2.5%.
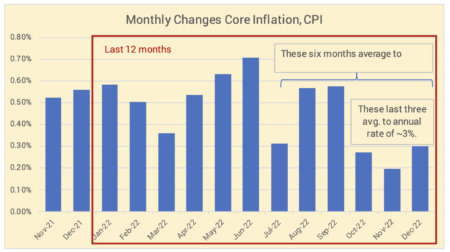
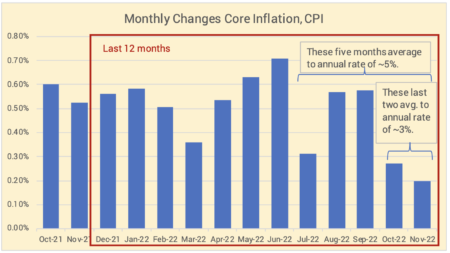
Core inflation excludes volatile energy and food components and was +0.30% for the month; that’s an increase from last month. (The difference from the measure above is the 4.5% decline the energy component of inflation; gasoline declined 9.4% in the month.) Inflation has totaled about 0.75% for the last three months: that translates to an annual rate of about 3%.
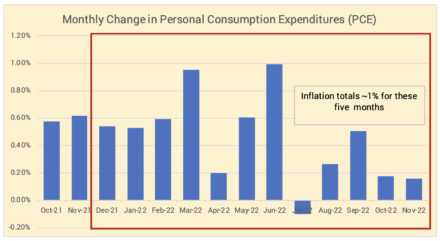
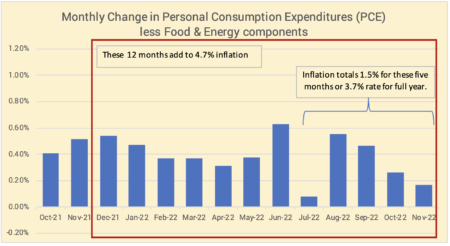
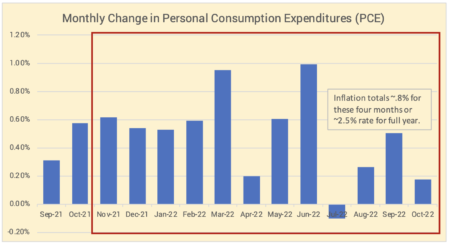
I show the most recent data, ending in November, for the monthly change in Personal Consumption Expenditures (PCE). This measure of inflation is one that the Federal Reserve Board favors. The data for December comes out at the end of January. The last five months add to 1% inflation. That translate to an annual inflation rate of ~2.4%.
== History of 12-month inflation ==
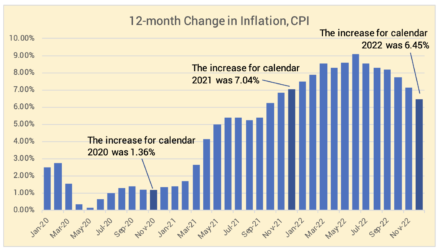
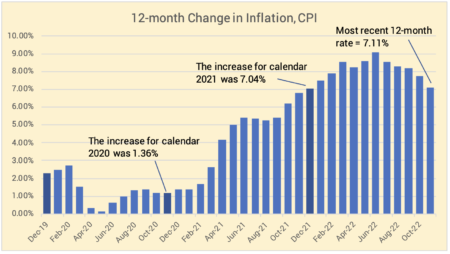
Full year inflation measured by the CPI-U shows that inflation for calendar year 2022 was 6.45%. The 12-month peak was 9.1% in June.
Conclusion: The rate of inflation in December was ~0.20%. The annual rate of inflation, based on past months of low inflation, is less than 3.0%. This is higher than the Federal Reserve’s target of 2% inflation, but we continue to have welcome news on inflation.
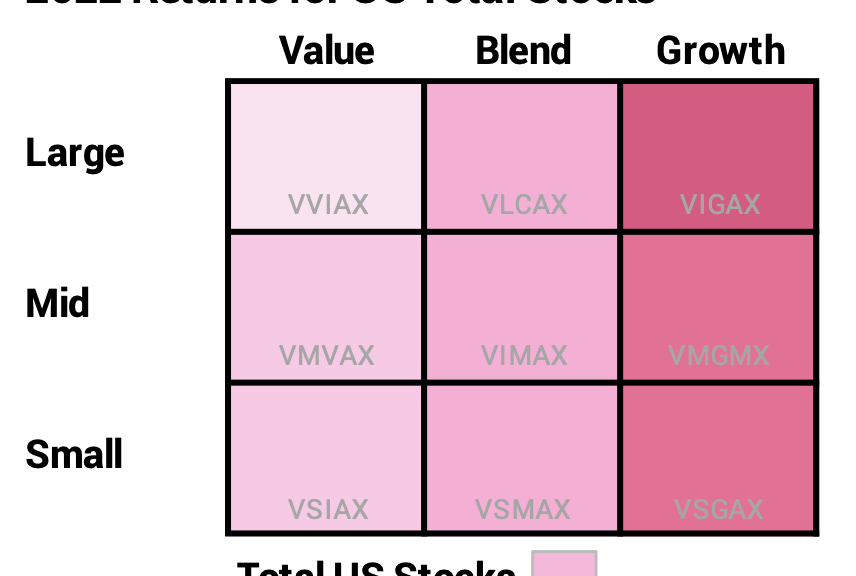
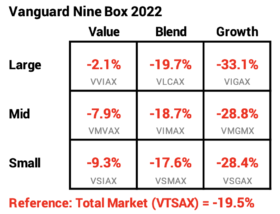
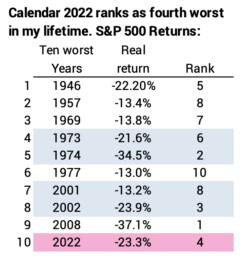
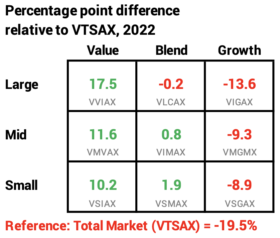
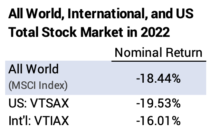
I like arranging the most recent calendar year returns in the 3 by 3 matrix of the Investment Style Box. I get a snapshot of what outperformed and what underperformed the US stock market as a whole. This post shows the nominal return for the total market in 2022 was -19.5%; that’s about -26% real, inflation-adjusted return and is the fourth worst calendar-year return in my lifetime. Value stocks as a category performed at least 30 percentage points better than Growth stocks; that’s almost a direct reversal of the results two years ago. Large Cap as a category outperformed Mid Cap or Small Cap. Over five, ten and 15 years, a Total Stock Market index fund has matched or outperformed seven of the nine boxes in the Style Box.
The columns in the Style Box are Value, Blend, and Growth stocks and rows are Large-Capitalization (Cap), Mid-Cap, and Small-Cap stocks. The nine boxes in the 3 by 3 matrix aren’t equal in market value of the stocks they hold. Large-Cap – the row of three boxes – is about 80% of the total value of all US stocks.
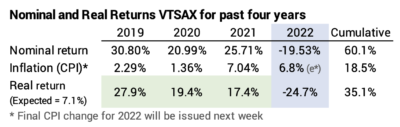
For reference, I’ve displayed the Style Box before: for 2017, 2018,2019,2020 and 2021. I use the Vanguard index fund that focuses on each of the nine segments. Their returns are very close to the index they are trying to match. I also display the -19.5% return for VTSAX – the Vanguard index fund that holds ~4,000 all traded US stocks. (Patti and I hold the Total US Stock fund FSKAX, also -19.5% in 2022.)
== Total US Stocks -19.5% ==
For perspective, the 2022 calendar year for VTSAX follows three years that averaged more than double the real 7.1% long-run average annual return for stocks. Calendar 2022 ranks as the fourth worst in my lifetime.
The back-to-back years of 1973-74 and 2001-02 were big portfolio killers.
== 2022 Relative to VTSAX ==
I show the percentage point difference for 2022 in each box relative to VTSAX. The relative winner by far was Value and the relative loser by far was Growth. Large Cap Value (LCV) outperformed Large Cap Growth (LCG) by 31 percentage points. This is basically a reversal of two years ago: LCV and LCG were almost the same last year, but in 2020 LCV lagged LCG by nearly 36 percentage points.
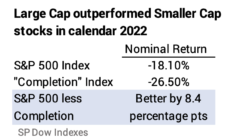
One can’t easily judge from the display, but LC outperformed MC and SC by about eight percentage points. The Dow S&P 500 represents about 80% of the total value of all stocks. Those stocks were -18.1% for the year, and the remaining ~3,500 stocks of the total market were -26.5% for the year.
== Five years: Growth still leads ==
Over the past five years, Growth leads Value for Large and Mid Cap. LCG averaged about 1 percentage point better per year than LCV. This is a sharp narrowing of the difference between the two: last year this five-year display showed that LCG outperformed LCV by more than 12 percentage points per year.
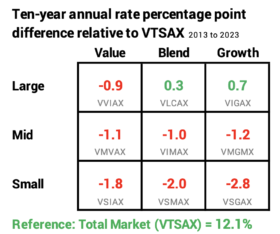
== Ten years: Large Cap and Growth
Over the last ten years, Large Cap and particularly Large Cap Growth was the place to be. Mid and Small Cap clearly lag. VTSAX outperformed seven of the nine boxes.
= 15 years: Large Cap and Growth ==
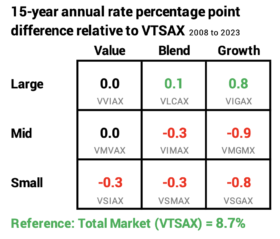
The percentage point differences between styles narrow with more years, but the story is the same for 15 years as for five and ten years. Large Cap and particularly Large Cap Growth was the place to be. Mid and Small Cap clearly lag. VTSAX matched or outperformed seven of the nine boxes. This period includes two of the ten worst years for stocks in my lifetime: 2008 and 2022.
Percentage point differences compound to a greater dollar difference with more years. LCG has been 1.7 percentage points per year better than MCG. The compound rate of 9.54% for LCG means $1 compounded to $3.92. The 7.77% rate for MCG means $1 compounded to $3.07. LCG compounded to about 28% more than MCG.
== The Future for US stocks ==
I don’t think these tea leaves predict the future. The fifth edition of Stocks for the Long Run uses data like this – looking at patterns of returns in past periods – and recommends that investors should tilt or overweight their portfolio to small cap and value stocks. Neither recommendation holds up for at least the past 15 years. This post showed no outperformance for small cap for decades. I conclude that one cannot predict which style will outperform in the future. One can only guess. I’m not guessing. I’m sticking with my Total Market fund.
== 2022 World stocks = -18.44% =
For reference: the total world market stock index, MSCI All Cap World Index was -18.4% for 2022. US stocks are roughly 55% of the total value of all stocks in the world. Total International Stocks (VTIAX) was -16.0% in 2022. (Patti and I own the ETF of this: VXUS which returned -16.1% for 2022.)
Conclusion: 2022 was a horrible year for stocks. Following three excellent years, the real return for stocks was about -25%. That ranks as the fourth worst in my lifetime.
Large Cap is about 80% of the total value of all stocks, and it outperformed smaller capitalization stocks by about eight percentage points in 2022. Large Cap Value stocks outperformed Large Cap Growth stocks in 2022 by more than 30 percentage points; this is basically the opposite of two years ago.
Over five, ten and 15 years, VTSAX – the Vanguard index fund for US Total Stock Market – has outperformed or matched seven of the nine boxes in the 3 by 3 matrix. I’m sticking with my Total US Market fund. (Patti and I own FSKAX.)
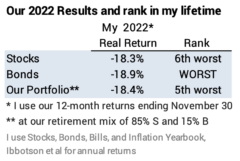
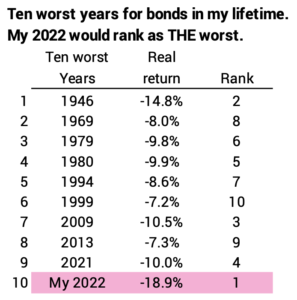
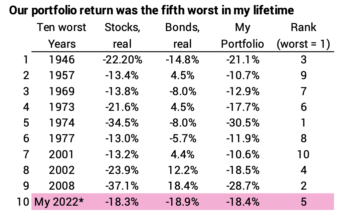
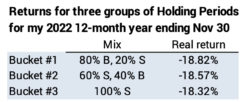
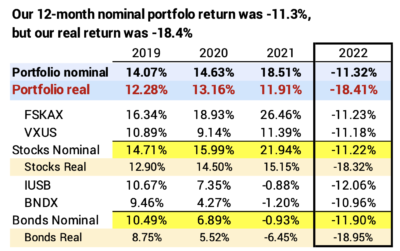
This post displays our portfolio return for our 12-month year ending November 30 and compares returns to prior years in my lifetimes. Stock returns were the 6th worst in my lifetime. Bond returns were THE worst in my lifetime. The return on our portfolio – for our current mix of stocks and bonds – was 5th worst in my lifetime. UGH.
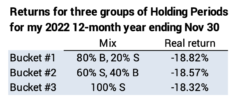
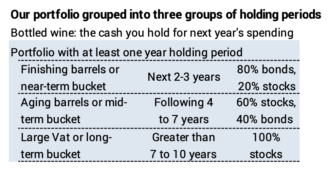
I also display our portfolio returns for three groups of holding periods: some like to view the groups as buckets. Since bond returns were worse than the very poor stock returns, the buckets were upside down: when stocks crater, the most conservative, near-term bucket is supposed to perform much better than more aggressive, longer-term buckets; that was not true this year and has never happened for at least my lifetime. The buckets are upside down.
== My stock and bond returns ==
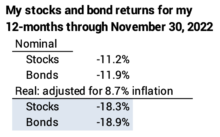
I showed the calculation of our real, inflation-adjusted stock and bond returns for my 12-month year in this post. I repeat them here:
Note: The picture for the 2022 calendar year will be different – worse for all of 2022 – than I display for my 12-month year ending November 30. For example, the calendar year year-to-date return for our stocks – with just today to close out 2022 –is -24% real return as compared to -18% on November 30.
Stocks: Our real, inflation-adjusted return for stocks rank as sixth worst in my lifetime.
Bonds: Our real return for bonds ranks as THE worst in my lifetime, and the worst in history stretching back to 1871.
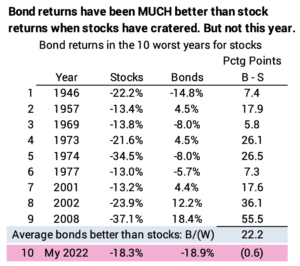
Bonds when stock crater: Bond returns historically have been MUCH better than stocks when they crater: bond returns averaged ~20 points better than stocks. That’s why I consider bonds as insurance. When stocks crater, we use our insurance – sell bonds for our spending: we minimize damage to our portfolio, and we buy time for stocks to recover. Bonds failed miserably as insurance this year.
Our portfolio return: The real return for our portfolio ranks as the fifth worst in my lifetime. Since we all had more money at the end of 2021 than we ever had in our lifetime, 2022 was the biggest annual dollar decline in our lifetime.
== Groups of holding periods ==
I also like to view my portfolio returns for three groups of holding periods. A holding period is the number of years that Patti and I will hold an investment before we sell the securities for our spending. All of us are selling slices of our portfolio each year for our spending, so we have many holding periods. I recast all the future years into three holding periods each with an appropriate mix of stocks and bonds for the length of the holding period.
Some describe the holding periods as three buckets. I imagine a process of emptying a wine barrel and bottling the contents to drink this next year; I changing the mix of stocks vs. bonds in barrels so that the wine properly ages. I’ve described my imaginary “bottling day” each December 15 several times; here’s one description.
I show the returns for my three groupings for the last eight years here. This year was VERY unusual: bond returns for my 12-month return period were worse than stocks. Any grouping that contains bonds will be worse than a grouping that solely contains stocks. The short-term bucket should have been the best performing bucket, but it was the worst. In this sense, the buckets are upside down.
Conclusion. I compared our stock, bond and portfolio returns to past years. Returns this year were dismal, but I don’t have to tell you that. Stock returns were 6th worst in my lifetime. Bond returns were THE worst in my lifetime. Stocks stunk and bonds were worse in return. One would think – given the sharp decline for stocks this year – that a conservative mix if 80% bonds and 20% stocks would perform better than an aggressive mix of 100% stocks, but that was not the case this year: all portfolios with greater mix of bonds performed worst than portfolios with less bonds.
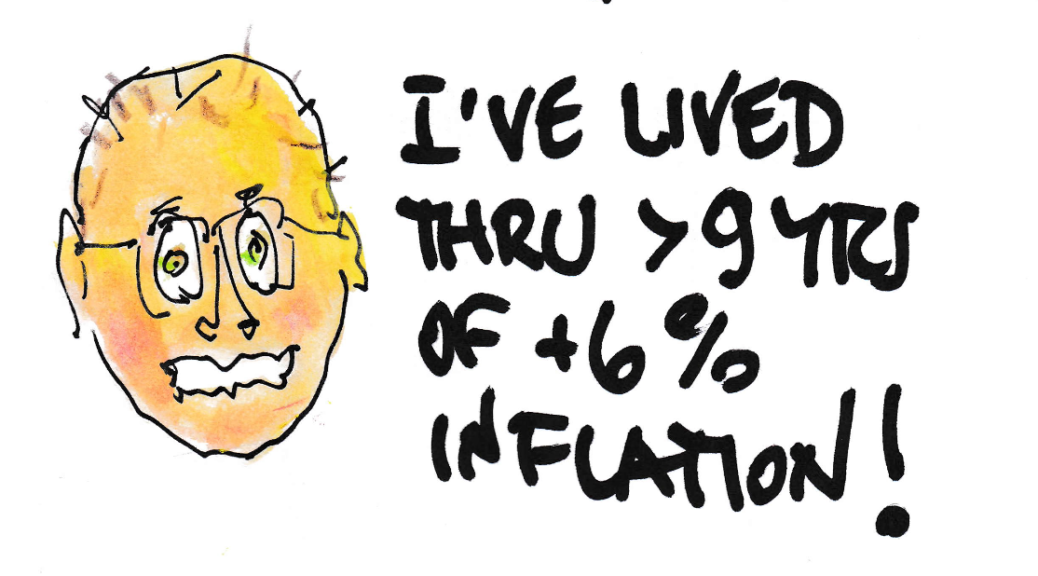
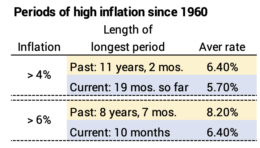
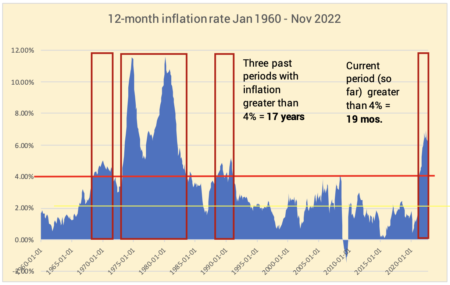
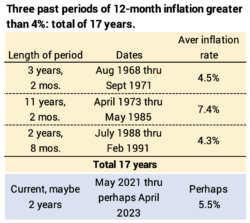
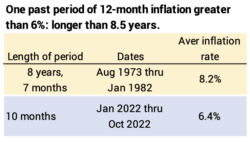
I was surprised: this period of inflation (so far) PALES in comparison to periods of high inflation that all of us retirees have lived through. I look at two slices of what one might consider as high inflation: we currently have experienced 19-months with inflation greater than 4%; this compares to the longest period of more than 11 years and three periods since 1959 that have totaled 17 years. The current period of inflation greater than 6% ran for 10 months ; this compares with a past a period that lasted longer than 8 years.
I previously wrote about inflation about 18 months ago when we first crossed 12-month inflation greater than 4%. This post is similar, but I think it is a clearer comparison to history.
== I use PCE from 1959 ==
I can download data from the St Louis Federal Reserve site for many indices of inflation. I chose the index for Personal Consumption Expenditures (PCE). The Federal Reserve Board favors this measure of inflation. This data series starts in 1959, and inflation has averaged 3.2% per year for the last 63 years. (The average for the last 100 years is just under 3%.)
== I’ll look at > 4% and > 6% ==
The Federal Reserve today has a target of 2% annual inflation. I think anything above 2% inflation is considered as high. I’ll look at two slices as obviously high: 12-month inflation > 4% and > 6%.
== The current period ==
Data for inflation for November was issued today. We get an accurate view of the most recent trends:
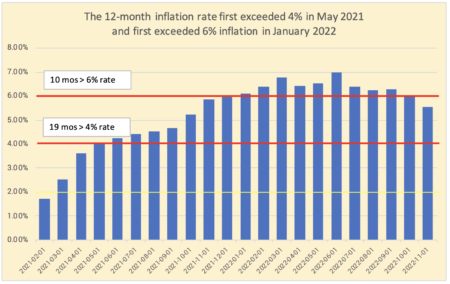
• May 2021 was the first month of 12-month inflation greater than 4%, more than 30 years from the last time that happened. The current run from May 2021 is 19 months.
• January 2022 marked the first month of 12-month inflation greater than 6% inflation, more than 39 years from the last time that happened. Data for November was issued today: a 10-month run >6% ended in October. I think we have put inflation > 6% behind us.
Monthly inflation for November was issued this morning: we are clearly below 6% for the last 12 months. We have a way to go to get below 4% and further to get to 2.0%.
How long will the current run of > 4% inflation last? That depends on inflation in future months. Inflation for the last five months averages to 2.4% annual rate; the rate for November is at an annual rate less than 2%. If I assume a rate 40% greater than the average of the last five months, our last month of inflation > 4% will be in April. That would mean we will have experienced two years of 12-month inflation > 4%.
Monthly inflation for November was issued this morning: another month of low inflation. The last five months are at an annual rate of 2.4%.
The Fed looks at a slightly different measure over the short term, the PCE less volative food and energy components. Inflation over the last five months averages 3.5% and not 2.4%. The rate of inflation for the last two months is less than the measure that includes Food and Energy.
== History of inflation > 4%? ==
The broad-brush view is that we can compare our current period of 19 months with inflation greater than 4% to a total of 17 years in the past with inflation greater than 4% per year! WOW! I certainly don’t remember all that. If April is out last month >4%, this period will be shorter than any other similar period.
== History of inflation > 6% ==
We can compare the current period of 10 months to the ~8½ year, hyper-inflation period that starting in 1973. Double WOW! WOW! I’ve lived through – you’ve lived through – more than nine years of inflation > 6%!
Conclusion: Our current period of high inflation – > 4% for the 12-month inflation rate – started in May 2021. That’s 19 months so far, and recent inflation rates suggest we might drop below the 4% rate in May. This would be the shortest of three past periods and far shorter than the longest period which lasted over 11 years.
Our current period contains ten months of > 6% inflation which ended in October. The ten months compares to a staggering past period lasting longer than eight years.
The inflation data for November came out on Tuesday: inflation was lower than last month and lower than expected. The recent data tracks to less than an annual 3% rate of inflation. That sounds like good news to me, but stocks fell about 4% over the next two days. I can’t figure that out. This post shows the recent changes in inflation for three measures of inflation: I’ve added the index of Personal Consumption Expenditures to the two measures of inflation that I’ve showed in previous posts.
After the announcement on inflation on Tuesday, the Fed raised interest rates on Wednesday by 0.50% and signalled another increase in January. US stocks fell a total 4% on Wednesday and Thursday. Maybe the market judges further actions to lower inflation aren’t needed and will risk recession. I’d argue that the Fed must keep the pressure on to get enough months of low inflation – low Core inflaition in particular – to conclude that they will hit their target over a 12-month period. What do you think?
== Three measures of inflation ==
The two most widely-reported measures of inflation are Seasonally-adjusted inflation and Core inflation.
Seasonally-adjusted inflation was +0.10% for the month and has totaled 1.0% over the last five months: that translates to an annual rate of ~2.5%.
Core inflation which excludes volatile energy and food components was +0.20% for the month; inflation in the past two months has totaled less than 0.50%: that translates to an annual rate of ~3%, but the last five months translate to ~5% annual rate.
I add a graph for the monthly change in Personal Consumption Expenditures (PCE). This measure is one that the Federal Reserve Board favors. October is the most recent month available. November’s result will be available on January 1. The last four months track to an annual inflation rate of 2.5%.
== History of 12-month inflation ==
The trend in 12-month inflation measured by CPI-U – a measure that is not seasonally adjusted – shows that inflation peaked in June at 9.1% and has declined to 7.1%.
Conclusion: The monthly rate of inflation in November was ~0.20%. This lower than last month and lower than expected. The annual rate of inflation, based on the recent months of low inflation – ranging from two to five months depending on the measure for inflation – is about 2.5% to 3.0%. This is higher than the Federal Reserve’s target of 2% inflation, but this is welcome news: we are on a trend that is much lower than the 9.1% 12-month rate we hit last June.
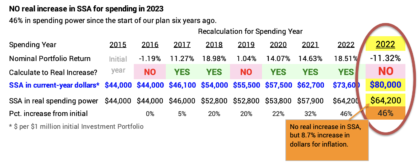
This post contains a short form spreadsheet you can use to Recalculate your Safe Spending Amount (SSA) for spending for 2024. This sheet has an added column to last year’s sheet, since none of us could calculate to a real increase this year. If we don’t calculate to a real increase next year, we’ll add another column, and so forth. We only revert to a simpler, two-column sheet, when we finally calculate to a real increase in our SSA.
== The spreadsheet ==
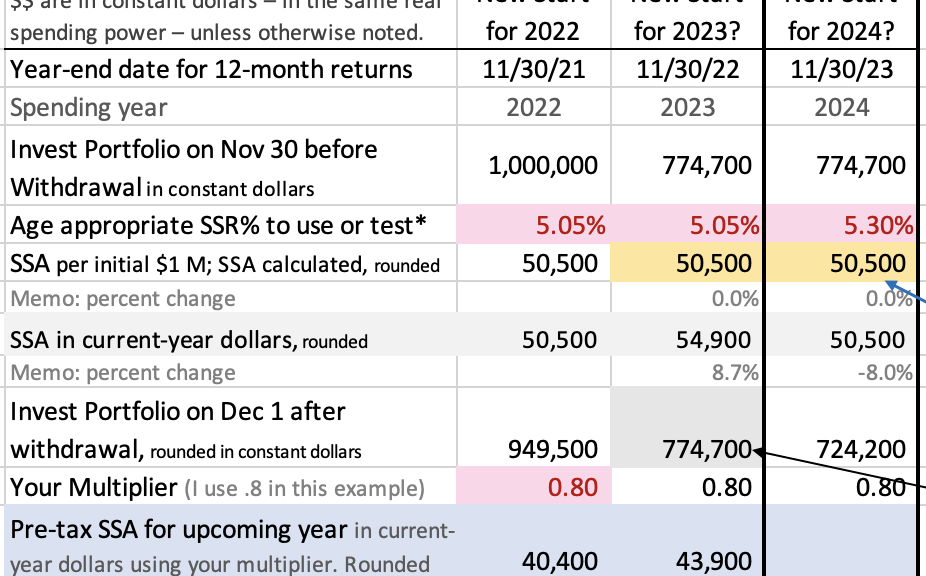
You had to enter five numbers in the table in cells D30 and D32-D35 for this year’s calculation for your SSA for calendar 2023. (PDF provided here.) The sheet shows in cell D41 that our real return for our portfolio for the past 12 months was -18.4%. Next December 1, I’ll enter numbers in the five cells highlighted in yellow in Column E to find our real portfolio return for the 12 months ending November 30, 2023.
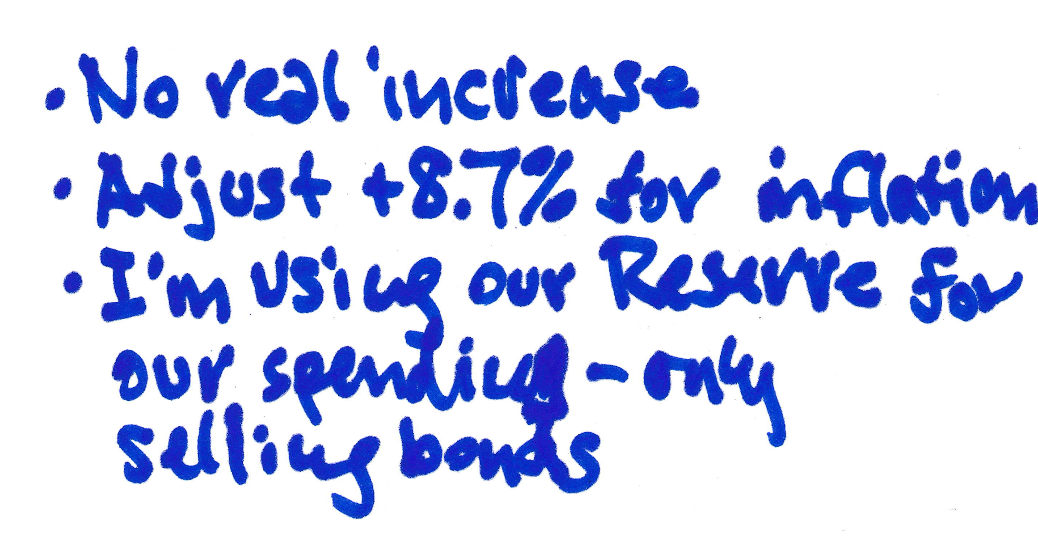
The spreadsheet calculates your real SSA for the upcoming year in Row 17. None of us calculated to a real increase in our SSA for the upcoming year. The spreadsheet shows the real SSA for our spending in 2023 stays the same at $50,500. Row 19 shows the inflation-adjusted amount is $54,900. The sheet will calculate your real SSA for spending in 2024 in cell E17 next year.
You have to decide what you are withdrawing from your Investment Portfolio for your spending to get your starting portfolio value for the upcoming year. The sheet would normally subtract the calculated SSA from your portfolio value on November 30. I decided Patti and I were using our Reserve (See Chapters 1 and 7, NEC), so in cell D21 I over-rode the subtraction and entered the same amount – $774,700 – that we had on November 30.
I entered our age-appropriate SSR% for next year: that’s 5.30%. A table from this post displays our age-appropriate SSR%s for a number of future years.
== Real increase in SSA next year? ==
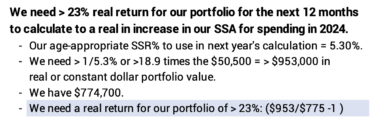
I can calculate that Patti and I need > 23% real portfolio return to calculate to a real increase in our SSA next year – for our spending in 2024. You can use similar steps. I think your result would be similar.
I’ll test 5.30% as our SSR% next year. For a real increase in our SSA, the real or constant dollar value of our portfolio times 5.30% must be greater than $50,500.
Our real or constant dollar portfolio value next November 30 has to be greater than $953,000.
At the start of our calculation year, December 1, we have $774,700. We need a greater than 23% real increase in portfolio value.
That looks like an impossible target! It may be more than a few years to earn back enough of what we are withdrawing for spending to calculate to our next real increase in SSA.
Conclusion. I recalculate each year to see if Patti and I earned a real increase in our Safe Spending Amount (SSA) for the upcoming year. I show a history of nine years of calculations in the post last week. This week I provide a short form calculation spreadsheet that you can use for your calculation. It shows the result for this year: no real increase in our SSA and therefore adds a column for next year’s calculation to the sheet I provided last year.
This is my ninth year of calculating our annual Safe Spending Amount (SSA; Chapter 2, Nest Egg Care [NEC]). Our portfolio return was -18% real return over the last 12 months, clearly the worst since the start of our retirement plan, and it was the worst since 2008. None of us following the steps in NEC calculate to a real increase in our SSA; your amount for 2023 is your 2022 amount increased by 8.7% for inflation. This post displays my detailed calculation sheet: the biggest change from a normal year is that Patti and I use our Reserve – selling only bonds – for our spending in 2023: my sheet shows our that our Investment Portfolio is almost the same as it was at the start of our plan nine years ago.
== Minus 18% real return ==
Our real – inflation-adjusted – portfolio return was -18% real return for the 12 months ending November 30. This was about -18% for stocks and -19% for bonds. This follows three years of very good stock and portfolio returns. Bonds have NEVER performed so badly relative to a year with lousy stock returns.
We’ve had three prior years of excellent, real real returns for our portfolio: roughly double the expected portfolio return for Patti and me of about 6.4% per year. This year, obviously, was a very poor one.
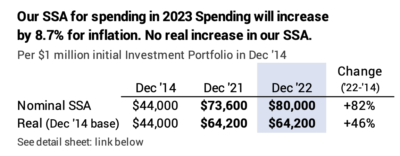
== SSA: 8.7% nominal increase ==
None of us will calculate to a real increase in our SSA. We’ll adjust last year’s SSA for inflation. This is the third of eight years that I’ve not calculated to a real increase in our SSA.
The eight year summary shows our SSA increased in real spending power in five of the eight years. Our SSA has increased by 46% in real spending power. The calculation this year – for spending in 2023 – is no real increase from last year: I only can adjust for inflation of 8.7%
== I’m using our Reserve ==
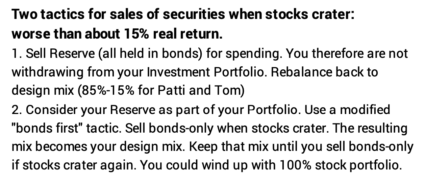
The -18% real return for stocks ranks as roughly the tenth worst annual return in the last 100 years. I hoped we would never see a year like this, but we have. What do we do? Chapters 1 and 7 NEC spell out the remedy: sell our Reserve for our spending: I have to sell securities now for the cash for taxes to withhold from our RMDs (a form of spending), and I’ll earmark the net value of securities that I’ll sell monthly throughout 2023 for our spending.
I describe in this post a slightly different tactic. View our total holdings of bonds as insurance; that’s why we’ve accepted low returns for bonds relative to stocks for years. Adopt the tactic of using your insurance – selling only bonds for your spending – in years when stock returns are this bad.
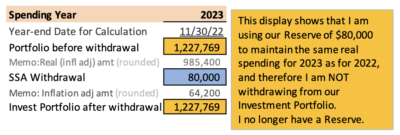
I’m displaying the first tactic in my calculation sheet. I display that I’m using our Reserve for our 2023 spending. Our Reserve has been apart from our Investment Portfolio. My calculation sheet therefore shows that I am not withdrawing – further depleting – our Investment Portfolio for our spending for 2023. (See annotation.) My calculation sheet shows our portfolio is the same value for the start of this upcoming year (December 1) as it was at end of the last year value (November 30).
This is an annotated portion of calculation sheet. I am using our Reserve and therefore not withdrawing from – further depleting – our investment portfolio. I end the year and start the next year with the same Investment Portfolio value.
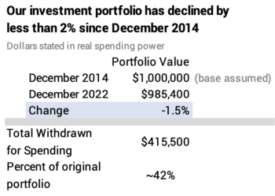
== Same portfolio value as 8 years ago ==
I can get frazzled if I look at the how much our portfolio declined in dollar value over the last 12 months. It’s a lot worse if I focus on the decrease in real spending power.
I don’t feel frazzled, however. The picture from the start of our retirement isn’t alarming. I’d rather look at that. My calculation sheet shows that our investment portfolio now is 1.5% less than it was in December 2014 and this is after seven years of withdrawals that total 42% of its initial spending power. And my SSA now is +46% greater in spending power than at the start.
== Tasks on Thursday, December 1 ==
What did I do on December 1? I prepared last week and here for the tasks this first week of December, so these tasks were simple.
• I went to the Morningstar site and looked up the 12-month returns ending November 30 for the four securities in our portfolio. I entered four numbers on the spreadsheet displayed at the start of this post to find our nominal returns for our stocks (-11.22%) and our bonds (-11.90%).
• I entered those two returns in the highlighted yellow cells on the calculation sheet. I previously extended the cells that calculate the rest of the spreadsheet. I manually entered the cell “NO”, our $80,000 SSA, and changed the cell that normally would have deducted our withdrawal for our SSA from our Investment Portfolio. Our investment portfolio is $985,400 for the start of the next 12-months. I won’t touch this sheet until next October when I enter the COLA from Social Security that I use as the measure for inflation.
• I sold bonds (a mix of IUSB and BNDX) in our retirement accounts to get the cash I want to withhold for taxes for our 2022 return.
• I transferred shares of FTBFX that I bought last week with a sale of IUSB to our taxable account equal to the balance of our RMDs. I’ll sell the bonds from our Reserve and FTBFX throughout 2023 for our spending: I’m hoping bonds bounce back during the year, and I’ll have some left over this time next year.
• I rebalanced our portfolio, the part that I did not earmark for our spending in 2023. The return differences between stocks and bonds and between US and International were small this year. The task was almost trivial this year, but I’ve returned our portfolio back to its exact design. I therefore can use 12-month returns ending next November 30 to calculate accurately calculate my portfolio returns to enter in my calculation sheet next year.
See Chapter 11, NEC for detail.
Note: My final rebalancing is in our IRA accounts; I do not want to incur taxable gains – pay taxes – to rebalance.
== Remaining Tasks ==
I have to wait two business days – until Monday – for the sales of bond ETFs to settle before I can ask Fidelity to send the amount to be withheld to the IRS.
I have to change the monthly amount that I will transfer to our joint checking account. I’ll do this after our December payment that comes from last year’s sale of securities.
Conclusion: I calculate our Safe Spending Amount for the upcoming year based on our 12-month returns ending November 30. None of us who follow the steps in Nest Egg Care calculate to a real increase. We inflation-adjust last year’s amount. Returns were so poor this year that I decided to use our Reserve for our spending for 2023. The math of my calculation sheet shows that I did not withdraw from our Investment Portfolio this year: I start on December 1 with the same portfolio value that we had on November 30.
I use November 30 as our calculation date to determine our Safe Spending Amount (SSA; Chapter 2, Nest Egg Care (NEC) for the upcoming year. This post shows the checklist I ran through this week. I think November 30 is a good 12-month calculation date: my checklist may be helpful to you. I have one mechanical change from my normal process, and I find that Patti’s life expectancy is a bit longer than I had found before.
1. Review the amount we will have or want for spending for 2023. Returns clearly won’t be good enough to support a real increase in our SSA. Our SSA – the gross amount of securities I would normally sell – will be last year’s SSA adjusted for inflation: +8.7% using Social Security’s COLA.
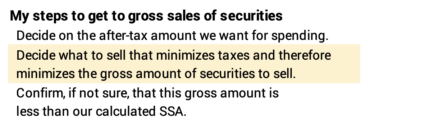
Patti and I won’t be paying ourselves the SSA I would normally calculate. I went through the exercise this year to understand our spending needs and desires. See here and here. I basically plan for our total pay (SS, other pension income, and payments from our next egg), net of taxes, to be 10% to 15% greater that we will generally spend in a year; that’s a pretty big cushion, and I like it that way. The part from our nest egg works out to less than our calculated SSA. Patti and I can start from what we want to pay ourselves since our calculated SSA has outpaced our spending. I start with what we want to pay ourselves, net of taxes, from our nest egg: I work from there to get to the gross value of securities I need to sell.
2. Review my tax plan that I first drafted in early August to make sure I am happy with what I am selling to get the net after taxes. We have to take our RMDs, but that is not enough for our total spending desires, so I need to decide what I will sell to get the balance: securities in our taxable account with capital gains or securities with no taxable income from my Roth account.
I’m generally trying to minimize Federal and State taxes for our current-year tax return and therefore minimize gross amount of securities we will sell. I usually hoard my Roth IRA to use when I can keep our Adjusted Gross Income (AGI) below a tripwire that triggers higher Medicare premiums (Part B and D). The first tripwire, based on AGI on our 2022 return, would cost the two of us ~$2,000 in greater premiums – lower SS payments – in 2024.
This year will be different: I’m not following my normal practice of selling securities in December to get our 2023 spending into cash before the start of the year. I won’t have any year-end sales from our taxable investment account. I’ll be selling monthly throughout 2023 to get the amount to be transferred to our checking from our investment account.
The capital gains that I would have recorded this year basically shift to the 2023 tax year. Shifting won’t have that much effect on our total 2023 taxes, since our RMDs will be less than this year.
3. Decide on the securities to sell in our IRAs for taxes to be withheld for our 2022 tax return. My tax plan gets me very close to the amount I need to withhold for federal and state taxes. I don’t like selling at what may be a very low point, but I have to get cash for taxes.
I will sell bonds and no stocks – that will be IUSB – to get this in cash from one or both of our IRAs. My sale of IUSB will settle a day or two after December 1. I’ll call and ask Fidelity then to directly withhold this amount for the IRS; our state taxes will be very low this year, and I won’t worry about that withholding.
This is my usual pattern: I withhold in December the total taxes I will pay for the current tax year; I generally do not pay quarterly estimated taxes. I suffer no penalties from late payment of taxes when I withhold close to our total taxes.
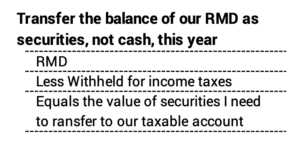
4. Pick the securities that Patti and I will transfer in-kind from our Traditional IRA accounts to our taxable account. This is the balance of our RMD after withholding taxes and this choice is again easy: solely bonds.
I plan on using the automatic sell & transfer feature at Fidelity for our monthly paychecks from our nest egg throughout 2023. This feature does not work with IUSB: Fidelity’s process works by selling an amount from a mutual fund and not ETF (IUSB) or other stock shares.
I chose to sell IUSB and buy FTBFX – Fidelity Total Bond fund – in our IRAs on Tuesday. I’ll call Fidelity on December 1 to execute the transfer of the shares of FTBFX that will be the balance of our RMDs. (As an alternative, I could have sold IUSB in our IRAs, transferred the cash, and then bought FTBFX in our taxable account.)
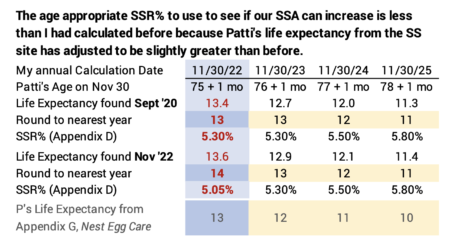
5. Check my calculation of Patti’s life expectancy. Patti’s life expectancy leads to the age-appropriate Safe Spending Rate I test to see if our SSA can increase in real spending power (SSR%; Chapters 2 and 4, NEC). The SSR% for this year clearly won’t figure in the calculation, since I know I can only inflation adjust this year. But I should see if my table, similar to the one I prepared in Appendix G, NEC is accurate.
I now use the Social Security (SS) Life Expectancy Calculator to find Patti’s Life Expectancy. I checked last checked on Patti’s life expectancies in 2020, and SS’s years were roughly one year greater than I had obtained seven years ago with the Vanguard Probability of Living Calculator, which no longer exists.
My check this week shows an increase from my table from two years ago. The SS Life Expectancy Tables and algorithm that predicts future mortality at any age adjust over time. Typically, this results in a progression of slightly longer life expectancies for any age.
My new table shows Patti’s life-expectancy is about 0.1 or 0.2 years greater than I last displayed. Rounding means that I need to change the SSR% that I had for this year’s calculation: I had her life expectancy for this as 13 years and it now rounds to 14 years. For accuracy, I need to change our age appropriate SSR% for this year’s calculation to 5.05% from 5.30%. Again, that won’t make a difference our SSA, since I’ll only be inflation-adjusting last year’s SSA.
6. I made of copy of my long form calculation sheet from last year and got it ready for the entries from the November return data I’ll get on December 1 (See here). 1) I filled the columns and formats as much as I can for this upcoming calculation. 2) I added 8.7% as the inflation adjustment I’ll use to adjust last year’s SSA to maintain the same spending power. 3) I corrected the age-appropriate SSR% for this November.
Conclusion: My 12-month calculation date for our SSA is November 30. I spent some time this week on a short checklist of tasks to be ready for the final calculations. The mechanics will be a bit different this year: I won’t be selling securities as part of our RMD; I’ll be transferring shares of a mutual fund and sell that on a monthly schedule throughout 2023. I found Social Security’s estimates of Patti’s life expectancies are a bit longer; this resulted in a change in my table of age-appropriate Safe Spending Rate (SSR%) to test to see if our Safe Spending Amount (SSA) might increase in real spending power.
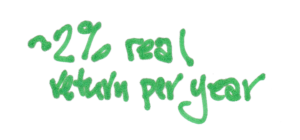
A reader – I’ll call him Jim – wrote and wanted my views on a financial instrument called a Single Premium Intermediate Annuity (SPIA). Earlier this year, before he had read Nest Egg Care (NEC), Jim purchased for $500,000 an annuity that pays $2,500 per month for the next 34 years, well past his life expectancy. This post describes this SPIA and its investment return. I conclude that the real return for this SPIA is low (~2% real return per year), less than half that Jim would earn from the worst-case sequence of future returns.
Rather than buying the annuity, Jim should pay himself his annual Safe Spending Amount (SSA; Chapter 2, NEC). He would meet his objectives for monthly cash payments deposited into his checking account, and he’d be much better off in the future. Don’t peel off a portion of your portfolio to buy a SPIA.
== The motivations ==
We all want to know what’s safe to spend. We DON’T WANT TO RUN OUT OF MONEY. Ever. We want to avoid the uncertain results of poor stock and bond returns. Without a framework that’s in Nest Egg Care, folks are flying blind as to what is safe to spend. NEC leads you to your annual Safe Spending Amount. You know what you can spend for the rest of your life, and it can only get better from your initial SSA.
Those who buy SPIAs take a portion of their financial assets – Jim picked 20% of his total financial assets – to lend to an insurance company who promises to pay them a fixed monthly payment for the number of years they pick. They’ve totally removed the risk of uncertain market returns on a portion of their nest egg, and they get comfort from the regular monthly deposit into their checking account.
But the key questions are, “What is my financial return? How does this compare to the worst I could expect if I held onto the money and invested it? What generates the most cash to be able to safely spend throughout my lifetime?”
== Jim’s annuity contract==
The financial transaction of a SPIA is analogous to a mortgage. You’re the bank, though. You want to lend money to someone you trust will be able to make fixed-dollar monthly payments for the number of years you desire – and you can add a “lifetime wrinkle” (explained below). Just like a mortgage, a portion of each payment that you receive is income and a portion is return of principal: you have no residual value at the end of all payments.
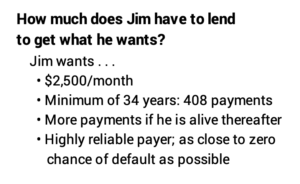
Here is Jim’s situation: Jim tells me he had $2.5 million at the end of last year. He has recurring pension and other income for the rest of his life such that $2,500 per month after taxes – $30,000 per year – currently meets all his spending needs. Jim, in essence, asked for quotes from insurance companies to find out how much he would have to lend them to receive . . .
1) $2,500/month for 34 years – 408 payments – to his age 95; this means that if Jim dies before age 95, heirs will receive the balance of the contractual payment stream, and
2) $2,500/month to Jim if he lives longer than age 95. This is the “lifetime wrinkle” that adds a bit of complexity to the return calculation.
The best quote he received – the lowest amount of money he needed to lend for this stream of payments – was $498,000. That’s what Jim paid for his annuity.
== Jim earns ~2% real return ==
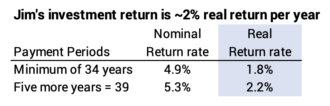
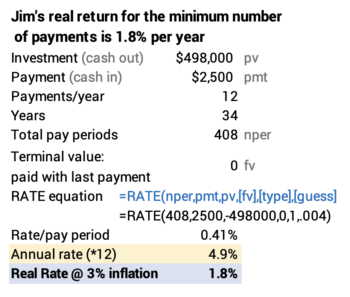
Jim earns ~2% real, annual return on his $498,000 investment.
I use the basic equations of a mortgage calculator to find the nominal rate of return that Jim is receiving. I use the RATE function in Excel for the minimum 408 payments of $2,500. The calculation tells me the monthly interest rate is .41%. I multiply this by 12 to get a nominal annual rate of 4.9%. I need to adjust this for inflation to get the real return rate. I assume inflation of 3% per year. That’s the average since 1926. That means Jim’s real return for the guaranteed period is 1.8% per year. (This post gives the math equation to adjust for inflation.)
Jim’s return rate is greater if the insurance company pays more than 408 payments. Let’s assume Jim lives to 100 and receives 60 more payments for a a total of 468 payments. In this case, Bob’s nominal investment return is 5.3% and his real return is 2.2%.
Let’s summarize it as ~2% real return. Jim earns ~2% real annual return on his $498,000 investment.
== Alternative worst case is ~5% real return ==
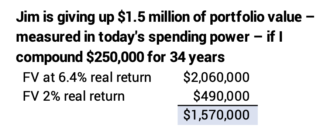
Jim would earn >5% real return per year if he (and heirs) kept the money invested in the same way Jim invests the balance of his portfolio. His SPIA returns less than half this.
We can look at what Jim would earn if returns were average in the future. The expected real return rate for Jim’s portfolio is 6.4% per year. Jim’s choice for the balance of his portfolio is 85% stocks and 15% bonds.
For perspective, this is a significant financial difference: Jim is paid back his $500,000 investment over 34 years. His average investment per year over the 34 years is half this initial $500,000. If I compound $250,000 for 6.4% and 2.0% per year, the difference in terminal value is about $1,500,000 in today’s spending power.
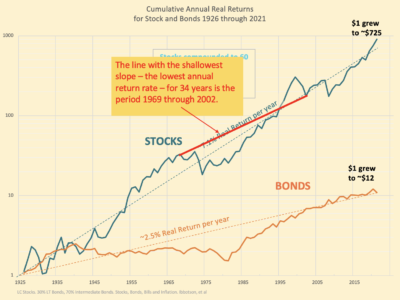
But we should really compare the return for the SPIA to the WORST return if Jim held on to the $500,000. We can find the lowest return rate for a 34-year sequence for a portfolio of 85% stocks and 15% bonds from the data from Ibbotson (since 1926) or Shiller (from 1871). The worst real, annual return for that portfolio mix is 4.9%: that’s the sequence from 1969 through 2002. Stocks returns are particularly poor: the sequence starts with the steepest six-year dive for stocks in history and ends with the second worst three-year dive in history. That sequence is one full percentage point lower in annual return than the next worst 34-year sequence of return in history.
A straight line on this semi-log graph is an annual return rate. The shallower the slope, the lower the return rate. The 34-year line with the shallowest slope for stocks is the red line from 1969 though 2002. The 34-year line that starts one year earlier or one year later is more than one percentage point greater in return.
The 2% real return Jim earns from his loan to the insurance company is about 40% of the the WORST real return rate that he would earn if he kept the money and invested it. The difference in these two return rates still compounds to $500,000 in today’s spending power. Jim’s SPIA is not a great investment.
== What would I have done? ==
I would not have purchased a SPIA. If I had purchased it, I would not consider buying another. I’d apply my appropriate SSR% to my Investment Portfolio.
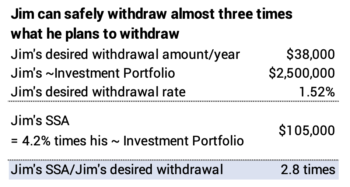
I would have assessed the situation this way. Jim had $2.5 million last December. He wants after-tax payments of $2,500 per month after taxes. That’s $30,000 per year. I’ll gross that up to $38,000 to allow for a rough estimate of taxes. Unlike the payments from the insurance company, we’ll assume this $38,000 retains the same spending power over time, meaning it adjusts for inflation each year.
$38,000 constant-dollar spending divided by $2,500,000 is about 1.5% spending or withdrawal rate. I look up Bob’s Safe Spending Rate (SSR%; Chapter 2 and Appendix D, NEC): his life expectancy from the SS Life Expectancy Calculator is 22 years; Jim’s SSR% is 4.2%. Jim could safely withdraw from his portfolio about 2.8 times the $38,000.
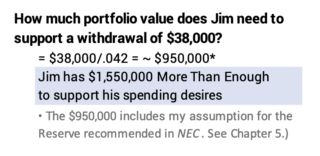
Here’s an alternate view: Jim needs about $950,000 to support $38,000 withdrawals. He has $2,500,000 or $1,550,000 that is More Than Enough to support his withdrawals for spending. This is a very pleasant problem to have!
Conclusion. This post looks at the return rate from a Single Premium Intermediate Annuity (SPIA). The real rate of return is about 2% per year for the example. This is less than half the rate of return you could earn assuming the worst, Most Harmful sequence of returns in history. You are financially much better off getting the cash for your spending by translating your annual Safe Spending Amount into monthly payments. Don’t peel off a portion of your total financial assets to buy a SPIA.