How much portfolio value do you need?
Posted on July 8, 2022

How much of portfolio value do you need for your spending for the rest of your life? It takes a number of steps and decisions to get to the answer. I went through two steps the past two weeks, here and here. This post does the math to find the amount of securities you need to sell from your nest egg each year. It then calculates the total financial portfolio you need to support those withdrawals from your nest egg. In the steps I follow, I pile up two cushions in the math steps for Patti and me. The two add to more than 25% more than the accurate math I use in Chapter 10, Nest Egg Care (NEC). I want those added cushions so that Patti and I have NO, NO, NO emotional stress about our financial future. We’re at the age where we should be totally stress free and focusing on enjoying more.
== Background ==
As I stated in the last two posts, Patti and I are in the category of The Happy Campers in Chapter 10, NEC: we have More Than Enough portfolio value to support our desired spending. My last calculation of our Safe Spending Amount (SSA) showed Patti and I can pay ourselves 46% more in real spending power for 2022 than we did in 2015; our real level of spending has not changed; I judge it won’t change much in the future. That 46% increase in our ability to spend stems from 46% greater portfolio value than we need; I’ve annotated our detailed calculation sheet here.
== The steps ==
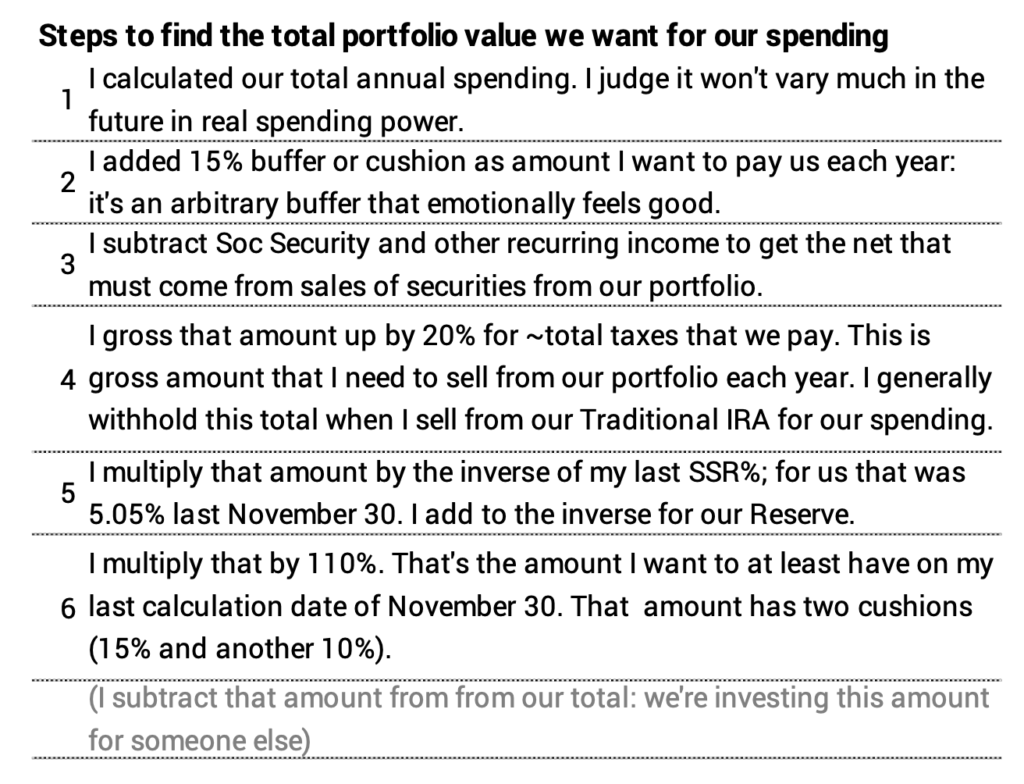
Here are the steps I go through in this post to calculate an amount of portfolio value that gives me NO DOUBT that Patti and I have enough for our spending for the rest of our lives. I’ve added emotional cushions that mean I calculate about 25% more than I would calculate following the math in Chapter 10, NEC. That 25% emotional cushion gives me far less stress about monthly cash flow, the effect of bad variations of stock returns – like this year, or the worry about one of us living so long that we could possibly deplete our portfolio.
== Herb and Wendy ==
Let’s walk through the steps using an example. This is for a couple, Herb and Wendy.
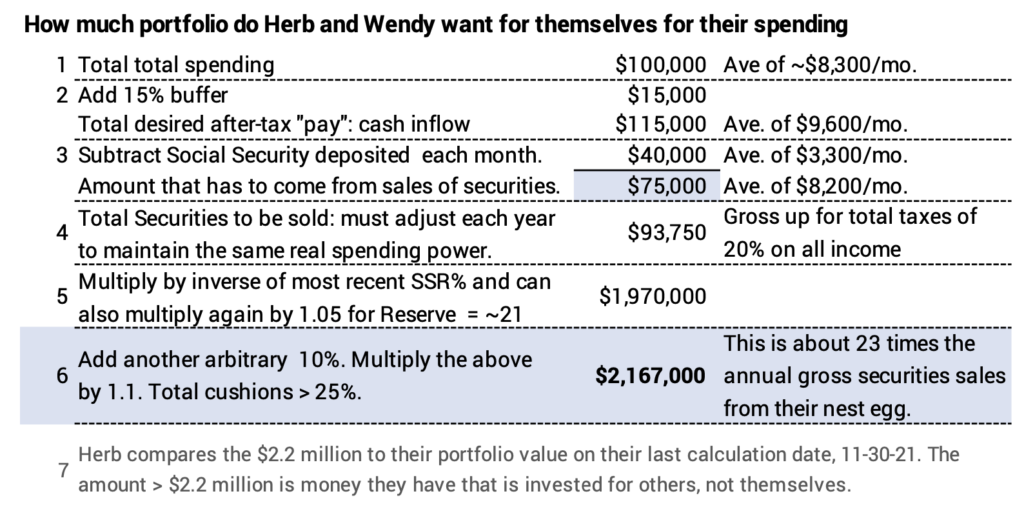
1. Herb and Wendy find their spending averages $8,300 per month or $100,000 per year. They’re happy with this. They judge that that won’t change much in real spending power for the rest of their lives.
2. Herb adds a 15% buffer to set total “pay” – total cash inflow – to $9,600 per month or $115,000 per year. Like me, he likes the routine of seeing more cash coming in each month than goes out. He likes to carry a high checkbook balance. He’ll deal with the amount that should be left over at the end of the year; that’s a nice problem to have. He finds life is less stressful that way.
3. Herb subtracts their Social Security payments as their sole source of other income for spending. (Patti and I have a small amount of income from a defined benefit retirement plan from years ago that I’d deduct, but I’d lower its spending power since it does not adjust for inflation.) Herb now knows how much – net of taxes – has to come from sales of securities from their portfolio: about $75,000.
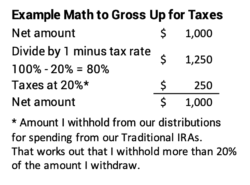
4. Herb grosses up the $75,000 for total taxes that he pays. He sorts this out the way I sort it out: I basically withhold all taxes for the year when I take our withdrawal for spending from our Traditional IRAs. I’ve reviewed past tax returns and see that I won’t make a mistake for this exercise if I assume 20% as the percentage to use to gross up total security sales. Herb similarly uses 20%. Herb divides the $75,000 he wants to net by 80% to get gross securities that he needs to sell each year: $94,000. That amount is in constant dollars and will adjust for inflation each year.
5. Herb multiplies the $94,000 by the inverse of the Safe Spending Rate (SSR%, Chapter 2 NEC) that he used on his last calculation date. (He can use that SSR% because all nest eggers stepped up to a new age-appropriate SSR% this past year due to the excellent returns in 2021.)
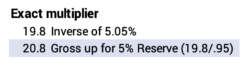
Herb and Wendy are older and use the same SSR% that Patti and I use 5.05% (Patti was 74 last November 30 with life expectancy of 14 years; see Appendix D, NEC.) The inverse is about 20. (Herb’s building cushions: he could or could not up that by 5% for the Reserve described in Chapter 7, NEC.) Herb uses 21 as his multiplier and gets a total of ~$2.0 million.
6. Herb arbitrarily adds another ~10% cushion. He multiples the $2.0 million by 1.1 and gets $2.2 million. The sum of all these cushions add to more than 25%. One reason Herb makes it that high is so that he can explain to Wendy that his calculations say they have 25% more than they will ever spend in their lives. DO NOT WORRY. Focus on figuring out how to ENJOY MORE.
7. Herb looks back at his brokerage statements on his last calculation date and finds he had more than $2.2 million. That added amount is invested for someone else: their heirs or charities that are dear to them. I’d think that this could be invested differently than the $2.2 million that’s invested for Herb and Wendy. I discuss this in next week’s post.
Conclusion. In Chapter 10 Nest Egg Care I show the math to calculate how much portfolio you need for a desired spending level. The steps are more detailed. This post is the third in a sequence and calculates 1) how much of your monthly or annual “pay” – that’s the cash inflow to our checking account for Patti and me – must come from sales of securities from your nest egg; and 2) how that total translates to the portfolio value you KNOW is enough for your spending for the rest of your life (or lives). I personally add more than a 25% cushion to the calculations. Patti and I had that amount (and more) on our last calculation date, November 30. The message to our brains is clear: DO NOT WORRY. You can’t run out of money. Focus instead on figuring out how to ENJOY MORE. NOW.