How attractive is the financial return of a Single Premium Immediate Annuity (SPIA)?
Posted on November 18, 2022

A reader – I’ll call him Jim – wrote and wanted my views on a financial instrument called a Single Premium Intermediate Annuity (SPIA). Earlier this year, before he had read Nest Egg Care (NEC), Jim purchased for $500,000 an annuity that pays $2,500 per month for the next 34 years, well past his life expectancy. This post describes this SPIA and its investment return. I conclude that the real return for this SPIA is low (~2% real return per year), less than half that Jim would earn from the worst-case sequence of future returns.
Rather than buying the annuity, Jim should pay himself his annual Safe Spending Amount (SSA; Chapter 2, NEC). He would meet his objectives for monthly cash payments deposited into his checking account, and he’d be much better off in the future. Don’t peel off a portion of your portfolio to buy a SPIA.
== The motivations ==
We all want to know what’s safe to spend. We DON’T WANT TO RUN OUT OF MONEY. Ever. We want to avoid the uncertain results of poor stock and bond returns. Without a framework that’s in Nest Egg Care, folks are flying blind as to what is safe to spend. NEC leads you to your annual Safe Spending Amount. You know what you can spend for the rest of your life, and it can only get better from your initial SSA.
Those who buy SPIAs take a portion of their financial assets – Jim picked 20% of his total financial assets – to lend to an insurance company who promises to pay them a fixed monthly payment for the number of years they pick. They’ve totally removed the risk of uncertain market returns on a portion of their nest egg, and they get comfort from the regular monthly deposit into their checking account.
But the key questions are, “What is my financial return? How does this compare to the worst I could expect if I held onto the money and invested it? What generates the most cash to be able to safely spend throughout my lifetime?”
== Jim’s annuity contract ==
The financial transaction of a SPIA is analogous to a mortgage. You’re the bank, though. You want to lend money to someone you trust will be able to make fixed-dollar monthly payments for the number of years you desire – and you can add a “lifetime wrinkle” (explained below). Just like a mortgage, a portion of each payment that you receive is income and a portion is return of principal: you have no residual value at the end of all payments.
Here is Jim’s situation: Jim tells me he had $2.5 million at the end of last year. He has recurring pension and other income for the rest of his life such that $2,500 per month after taxes – $30,000 per year – currently meets all his spending needs. Jim, in essence, asked for quotes from insurance companies to find out how much he would have to lend them to receive . . .
1) $2,500/month for 34 years – 408 payments – to his age 95; this means that if Jim dies before age 95, heirs will receive the balance of the contractual payment stream, and
2) $2,500/month to Jim if he lives longer than age 95. This is the “lifetime wrinkle” that adds a bit of complexity to the return calculation.
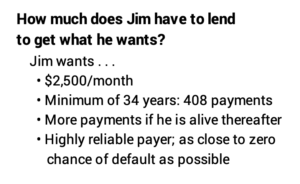
The best quote he received – the lowest amount of money he needed to lend for this stream of payments – was $498,000. That’s what Jim paid for his annuity.
== Jim earns ~2% real return ==
Jim earns ~2% real, annual return on his $498,000 investment.
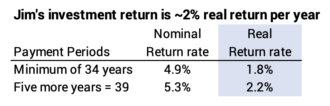
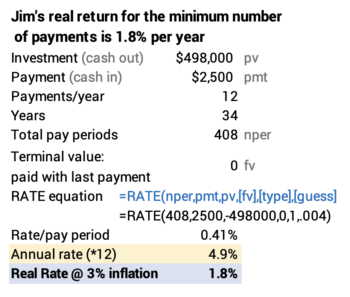
I use the basic equations of a mortgage calculator to find the nominal rate of return that Jim is receiving. I use the RATE function in Excel for the minimum 408 payments of $2,500. The calculation tells me the monthly interest rate is .41%. I multiply this by 12 to get a nominal annual rate of 4.9%. I need to adjust this for inflation to get the real return rate. I assume inflation of 3% per year. That’s the average since 1926. That means Jim’s real return for the guaranteed period is 1.8% per year. (This post gives the math equation to adjust for inflation.)
Jim’s return rate is greater if the insurance company pays more than 408 payments. Let’s assume Jim lives to 100 and receives 60 more payments for a a total of 468 payments. In this case, Bob’s nominal investment return is 5.3% and his real return is 2.2%.

Let’s summarize it as ~2% real return. Jim earns ~2% real annual return on his $498,000 investment.
== Alternative worst case is ~5% real return ==
Jim would earn >5% real return per year if he (and heirs) kept the money invested in the same way Jim invests the balance of his portfolio. His SPIA returns less than half this.
We can look at what Jim would earn if returns were average in the future. The expected real return rate for Jim’s portfolio is 6.4% per year. Jim’s choice for the balance of his portfolio is 85% stocks and 15% bonds.

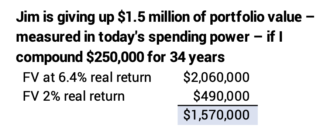
For perspective, this is a significant financial difference: Jim is paid back his $500,000 investment over 34 years. His average investment per year over the 34 years is half this initial $500,000. If I compound $250,000 for 6.4% and 2.0% per year, the difference in terminal value is about $1,500,000 in today’s spending power.
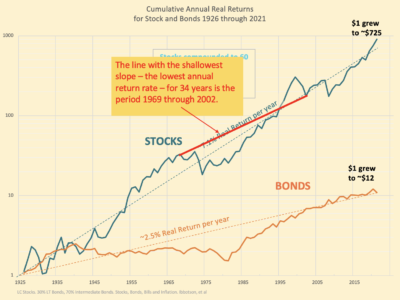
But we should really compare the return for the SPIA to the WORST return if Jim held on to the $500,000. We can find the lowest return rate for a 34-year sequence for a portfolio of 85% stocks and 15% bonds from the data from Ibbotson (since 1926) or Shiller (from 1871). The worst real, annual return for that portfolio mix is 4.9%: that’s the sequence from 1969 through 2002. Stocks returns are particularly poor: the sequence starts with the steepest six-year dive for stocks in history and ends with the second worst three-year dive in history. That sequence is one full percentage point lower in annual return than the next worst 34-year sequence of return in history.
The 2% real return Jim earns from his loan to the insurance company is about 40% of the the WORST real return rate that he would earn if he kept the money and invested it. The difference in these two return rates still compounds to $500,000 in today’s spending power. Jim’s SPIA is not a great investment.
== What would I have done? ==
I would not have purchased a SPIA. If I had purchased it, I would not consider buying another. I’d apply my appropriate SSR% to my Investment Portfolio.
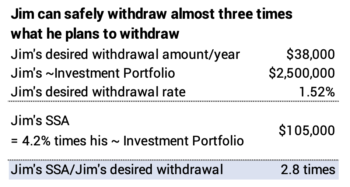
I would have assessed the situation this way. Jim had $2.5 million last December. He wants after-tax payments of $2,500 per month after taxes. That’s $30,000 per year. I’ll gross that up to $38,000 to allow for a rough estimate of taxes. Unlike the payments from the insurance company, we’ll assume this $38,000 retains the same spending power over time, meaning it adjusts for inflation each year.
$38,000 constant-dollar spending divided by $2,500,000 is about 1.5% spending or withdrawal rate. I look up Bob’s Safe Spending Rate (SSR%; Chapter 2 and Appendix D, NEC): his life expectancy from the SS Life Expectancy Calculator is 22 years; Jim’s SSR% is 4.2%. Jim could safely withdraw from his portfolio about 2.8 times the $38,000.
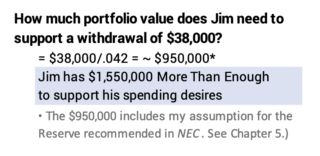
Here’s an alternate view: Jim needs about $950,000 to support $38,000 withdrawals. He has $2,500,000 or $1,550,000 that is More Than Enough to support his withdrawals for spending. This is a very pleasant problem to have!
Conclusion. This post looks at the return rate from a Single Premium Intermediate Annuity (SPIA). The real rate of return is about 2% per year for the example. This is less than half the rate of return you could earn assuming the worst, Most Harmful sequence of returns in history. You are financially much better off getting the cash for your spending by translating your annual Safe Spending Amount into monthly payments. Don’t peel off a portion of your total financial assets to buy a SPIA.