What’s the history of inflation, and might history foretell the future?
Posted on May 28, 2021
I posted last week about the latest calculation of 4.2% annual rate of inflation, May 2020 to May 2021. This is greater than the Federal Reserve’s long-term objective of expectations of annual inflation to be “well anchored at 2 percent”. Is 2 percent a reasonable objective? The purpose of this post is to describe the patterns of inflation over the 95 years from 1926 through 2020.
Inflation has averaged 2.9% per year, but that’s not been a steady rate. We had a long period of deflation – inflation below 0% – and two other periods where inflation averaged 2½ times the long-run average. The key takeaway for me, though, is the long, stable period of inflation for the past 39 years. Does this mean we have learned how to control inflation? I’d like to think so, but perhaps that’s wishful thinking.
== Average inflation, 1926 through 2020 ==
What’s the history of inflation? I gather the calendar-year inflation data from this site. Inflation for the 95 years from 1926 through 2020 has averaged 2.9% per year: both the simple average and compound average growth rate round to 2.9%. It took ~$14.50 at the end of 2020 to equal the spending power of $1 at the start of 1926.
== I divide the history into five periods ==
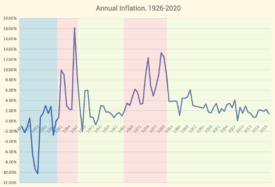
I show a summary table and a graph of annual inflation rates.
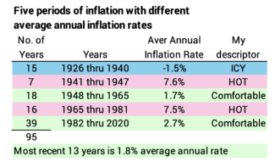
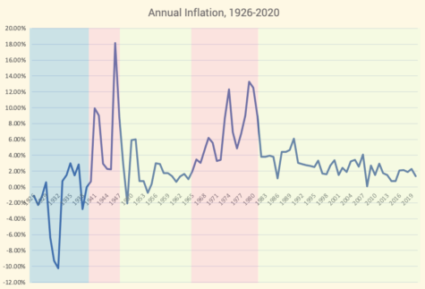
What does the summary table and graph show? I highlight five periods: one is a 15-year period where we averaged deflation; two periods – adding to 23 years – are high inflation, averaging over 7.5% per year; and two periods – adding to 54 years – are modest-to low inflation, averaging less than 2.7% per year. The last 39 years is the longest period of stable inflation, and the last 13 have been low inflation.
1. The 15-year period from 1926 through 1940 was a period of deflation. The cumulative deflation over this period was about 20%. Three straight years in the Great Depression – 1930, ’31 and ’32 – added to -24% deflation! If you were lucky to be employed in those years and received a 20% pay cut, you were ahead in real spending power!
2. The seven-year period 1941 through 1947 was high inflation. Inflation averaged 7.6% inflation per year. These are the War years. The peak year for inflation was the first year after the end of the War, 1946: 18%; three years later, deflation was -2%!
3. The 18-year period 1948 through 1965 was low inflation. Inflation averaged 1.7% per year.
4. The 16-year period 1965 though 1981 was high inflation. Inflation averaged 7.5%. Inflation added to 25% for the two years 1979-80. You would have needed more than 25% increases in pay just to get ahead in real spending power.
1965 also was the start of the worst sequence of real stock returns in history. Stocks did not exceed their 1965 level, measured in real spending power, for 17 years. The MOST HORRIBLE sequence for combined stock and bond returns started in 1969: we nesteggers always use that worst case to determine our Safe Spending Rate (SSR%; see Chapter 2, Nest Egg Care [NEC].)
5. The 39-year period from 1982 through 2020 is modest to low inflation. Inflation averaged 2.7% over this 39-year period. Inflation exceeded 6% in one of the 39 years. This is the longest period of modest to low inflation. Inflation in the last 13 years has averaged 1.8%.
== What’s this mean? ==
Heck, I don’t know what this means. I do know that I don’t want events that rock the boat, and a sharp increase or decrease in inflation – actually the long-term expectation for inflation – would be an event that rocks the boat. Spending habits change based on the outlook on future inflation:
• Folks tend not to spend if the outlook is deflation – money is getting more valuable; prices are falling; things are going to cost less if we wait. That drop in spending is going to hurt the economy.
• The opposite is true if the outlook is high inflation – folks tend to buy anything NOW since money is rapidly losing value; prices are increasing; things will cost a lot more in the future. That increase in spending is going to artificially fuel or overheat the economy, and it will crash later when folks run out of new things to buy.
I’d like to think this past 39-year run of modest-to-low inflation – and especially the last 13 years – is a good predictor of the future: I’d like to think “they” – meaning the Federal Reserve, I guess – know to control inflation. But I’m not an economist and have no insight as to whether that might be true.
The good news: with our worst-case planning and decisions following the steps in NEC, we know our annual Safe Spending Amount at least maintains its real spending power over time. We also know our spending rate is safe: we should be confident that we will NOT RUN OUT OF MONEY no matter what hits us in the future.
Conclusion. This post looked at the long history of inflation, 1926 through 2020. Inflation has averaged 2.9% per year, but we’ve had long stretches of deflation and high inflation – average rates 2½ times the long run average. Inflation has been the most stable in the last 39 years, and has been consistently low in the last 13. We investors like stable and low inflation. I’d like to think that the last 39 years tell us that “they” know how to avoid big changes inflation, but I have no idea if that is true.