What segments of US stocks outperformed in 2020?
Posted on January 8, 2021
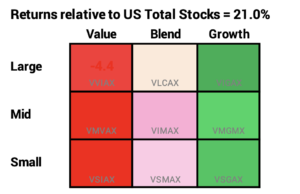
I like looking at the Vanguard Style Box (I call it a Nine Box.) at the end of the year to get a snapshot of what outperformed and what underperformed the US stock market as a whole. This post shows 2020 results. Large-Cap Growth again led the pack and by a WIDE MARGIN in 2020. Value lagged again but by MUCH WIDER MARGIN than in the past. I’ve displayed the Nine Box before: for 2017, and 2018 and 2019.
== Total US Stocks = +21.0% ==
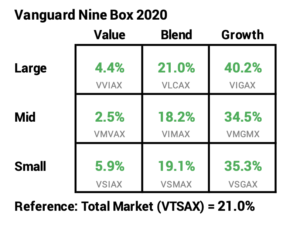
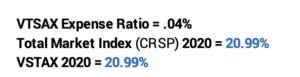
I use the Vanguard index fund that focuses on each of the nine segments. I display for reference the 21.0% return for VTSAX – the index fund that holds ~3,600 all traded US stocks. (Patti and I hold the Total US Stock fund FSKAX = +20.8% in 2020; it was a bit more than VTSAX in 2019; I would expect the two to be virtually identical in return over time.)
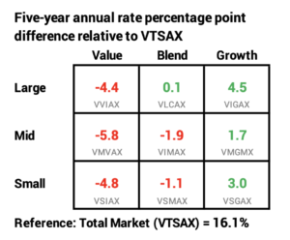
The columns are Value, Blend, and Growth stocks and rows are Large-Capitalization (Cap), Mid-Cap, and Small-Cap stocks. The nine boxes aren’t equal in market value of the stocks they hold. Large-Cap represents about 80% of the total value of all US stocks, for example.
== Each very close to the actual index ==
I check the data that Vanguard provides as to how well these funds perform against their peer index. We’d expect each index fund to return just a shade less than the index Vanguard is trying to mimic – basically by each fund’s Expense Ratio. The Expense Ratio for these nine averages .06%, but on average these funds only trail their peer index by .02%. Vanguard has figured out a way to overcome a bit of their Expense Ratio.
== Relative to VTSAX = 21.0% ==
I show the percentage point difference in each box relative to VTSAX – the Total US Market fund.
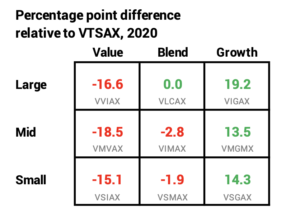
Large Cap Blend was the same as VTSAX. The three growth boxes were FAR BETTER than VTSAX. The three value boxes were FAR WORSE. The mid- and small-cap blend boxes didn’t match VTSAX.
Large-Cap Growth was BY FAR the winner in 2020: +19 percentage points better than VTSAX. Wow, that is a big difference. It was the winner in the prior three years in 2020.
Large-Cap Value was almost 17 percentage points worse and Mid-Cap Value was about 19 percentage points worse. That spread between Large-Cap Growth and Large-Cap Value is a staggering 36 points.
== Five years: Large-Cap Growth leads ==
Large-Cap growth has led the pack over five years, but not nearly so dramatically as this year. That five-year difference compounds to a significant difference, however, about 20% more from VIGAX than VTSAX.
Every year I look at the Nine Box and think, “I really missed the boat by not tilting to Growth.” Then I say, “Would I have really bet on Growth after last year? Maybe I would have bet on Value, and I would have REALLY BEEN UNHAPPY.” And, “Could I possibly pick which box or boxes will outperform in the next five or ten years?” “No.” I’m happy just hitting the average of all those boxes. Betting on a box or tilt is adding uncertainty and risk to my financial retirement plan, and that’s the last thing I want to do.
== World stocks = 16.82% =
For reference: the total world market stock index, MSCI All Cap World Index = 16.82% for 2020. US stocks are roughly 55% of the total value of all stocks in the world. Total International Stocks (VTIAX) = 11.28% in 2020. (Patti and I own the ETF of this = VXUS = 10.69%.)
Conclusion: 2020 was another terrific year for US stocks. Total US stocks were +21%. That follows +31% last year. Every year some segments of the market outperform and some to underperform. All growth stocks outdistanced the average by a wide margin in 2020: Large-Cap Growth beat the market average by 19 percentage points. Value stocks lagged by a wide margin: Large-Cap value lagged by about 17 percentage points. We all wish we could predict the future and pick the box that will outperform the average. I don’t think anyone can. I’m sticking right in the middle with a Total Stock Market fund.