What segments of the US market outperformed in 2017?
Posted on January 12, 2018
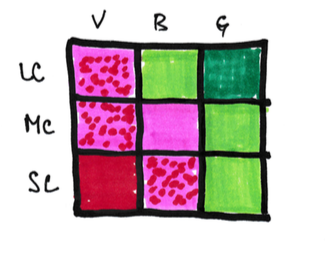
I like looking at the Vanguard Style Box (I call it a Nine Box.) at the end of the year to get a snapshot of what outperformed and what underperformed the US stock market as a whole. Vanguard displays this matrix of its index (and other) funds that focus on segments of the total US market. The columns are Value, Blend, and Growth stocks and rows are Large Capitalization (Cap), Mid Cap, and Small Cap stocks.
I display the 2017 returns for the segments. I’m using the returns for Vanguard’s index fund* for each of the boxes in the matrix.
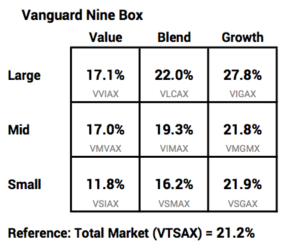
For reference, I display the Vanguard fund VTSAX as the measure for the change in the Total Stock Market. VTSAX is the capitalization value-weighted fund of essentially all US stocks – 3600 of them. The change in VTSAX is the change in the total market value of all US stocks. VTSAX increased by just under 21.2% last year, and therefore the total market capitalization value of the US stock market increased by 21.2% (Adding back the .04% expense ratio for VTSAX does not change the return rounded to nearest .1%.) Saying it a bit differently, the US stock market gave all investors, in aggregate, 21.2% more in 2017 than they had at the end of 2016.
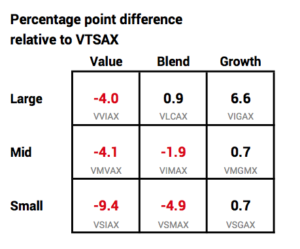
If you count the boxes, four were better than VSTAX and five were not. I display the percentage point difference from VTSAX in each box below. (Each box does not have the same percentage of the total market, so the numbers in the boxes won’t net to zero.) All in the growth column were better. All in the value column were worse. The best performer was Large Cap Growth (about 6.6 percentage points better than VTSAX) and the worst was Small Cap Value (about -9.4 percentage points lower than VTSAX). The difference between Large Cap Growth and Small Cap Value was 16 percentage points.
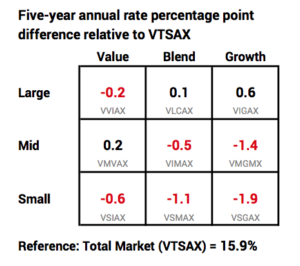
Common wisdom is that you can tilt your portfolio to outperform the average. The thinking is that Value will outperform Growth given enough years, and Small Cap will outperform Large or Mid Cap. Tilting these ways did not pay off for 2017 (above) and has not for the last five years (below).
For reference:
Total International Stocks (VTIAX) = 27.55%
Total world market stock index, MSCI All Cap World Index = 24.62%
* I display the “Admiral class” funds. These would be funds held at Vanguard that meet a greater investment minimum ($10,000). No greater than .07% expense ratio. VTSAX has a slightly lower expense ratio: .04%.