What segments of US stocks outperformed in 2022?
Posted on January 6, 2023
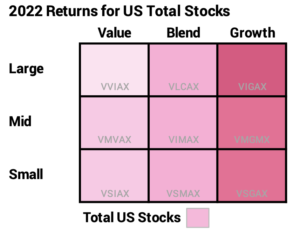
I like arranging the most recent calendar year returns in the 3 by 3 matrix of the Investment Style Box. I get a snapshot of what outperformed and what underperformed the US stock market as a whole. This post shows the nominal return for the total market in 2022 was -19.5%; that’s about -26% real, inflation-adjusted return and is the fourth worst calendar-year return in my lifetime. Value stocks as a category performed at least 30 percentage points better than Growth stocks; that’s almost a direct reversal of the results two years ago. Large Cap as a category outperformed Mid Cap or Small Cap. Over five, ten and 15 years, a Total Stock Market index fund has matched or outperformed seven of the nine boxes in the Style Box.
The columns in the Style Box are Value, Blend, and Growth stocks and rows are Large-Capitalization (Cap), Mid-Cap, and Small-Cap stocks. The nine boxes in the 3 by 3 matrix aren’t equal in market value of the stocks they hold. Large-Cap – the row of three boxes – is about 80% of the total value of all US stocks.
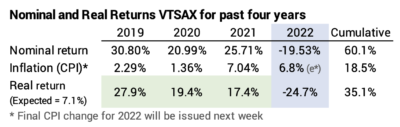
For reference, I’ve displayed the Style Box before: for 2017, 2018, 2019, 2020 and 2021. I use the Vanguard index fund that focuses on each of the nine segments. Their returns are very close to the index they are trying to match. I also display the -19.5% return for VTSAX – the Vanguard index fund that holds ~4,000 all traded US stocks. (Patti and I hold the Total US Stock fund FSKAX, also -19.5% in 2022.)
== Total US Stocks -19.5% ==
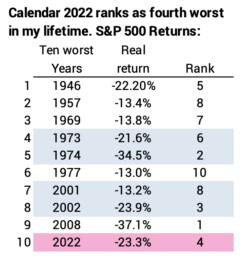
For perspective, the 2022 calendar year for VTSAX follows three years that averaged more than double the real 7.1% long-run average annual return for stocks. Calendar 2022 ranks as the fourth worst in my lifetime.
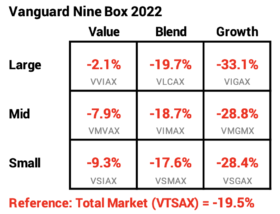
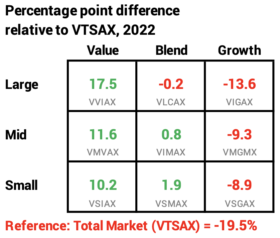
== 2022 Relative to VTSAX ==
I show the percentage point difference for 2022 in each box relative to VTSAX. The relative winner by far was Value and the relative loser by far was Growth. Large Cap Value (LCV) outperformed Large Cap Growth (LCG) by 31 percentage points. This is basically a reversal of two years ago: LCV and LCG were almost the same last year, but in 2020 LCV lagged LCG by nearly 36 percentage points.
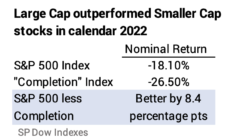
One can’t easily judge from the display, but LC outperformed MC and SC by about eight percentage points. The Dow S&P 500 represents about 80% of the total value of all stocks. Those stocks were -18.1% for the year, and the remaining ~3,500 stocks of the total market were -26.5% for the year.
== Five years: Growth still leads ==
Over the past five years, Growth leads Value for Large and Mid Cap. LCG averaged about 1 percentage point better per year than LCV. This is a sharp narrowing of the difference between the two: last year this five-year display showed that LCG outperformed LCV by more than 12 percentage points per year.

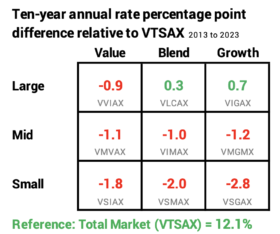
== Ten years: Large Cap and Growth
Over the last ten years, Large Cap and particularly Large Cap Growth was the place to be. Mid and Small Cap clearly lag. VTSAX outperformed seven of the nine boxes.
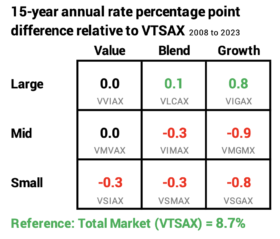
= 15 years: Large Cap and Growth ==
The percentage point differences between styles narrow with more years, but the story is the same for 15 years as for five and ten years. Large Cap and particularly Large Cap Growth was the place to be. Mid and Small Cap clearly lag. VTSAX matched or outperformed seven of the nine boxes. This period includes two of the ten worst years for stocks in my lifetime: 2008 and 2022.
Percentage point differences compound to a greater dollar difference with more years. LCG has been 1.7 percentage points per year better than MCG. The compound rate of 9.54% for LCG means $1 compounded to $3.92. The 7.77% rate for MCG means $1 compounded to $3.07. LCG compounded to about 28% more than MCG.
== The Future for US stocks ==
I don’t think these tea leaves predict the future. The fifth edition of Stocks for the Long Run uses data like this – looking at patterns of returns in past periods – and recommends that investors should tilt or overweight their portfolio to small cap and value stocks. Neither recommendation holds up for at least the past 15 years. This post showed no outperformance for small cap for decades. I conclude that one cannot predict which style will outperform in the future. One can only guess. I’m not guessing. I’m sticking with my Total Market fund.
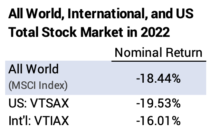
== 2022 World stocks = -18.44% =
For reference: the total world market stock index, MSCI All Cap World Index was -18.4% for 2022. US stocks are roughly 55% of the total value of all stocks in the world. Total International Stocks (VTIAX) was -16.0% in 2022. (Patti and I own the ETF of this: VXUS which returned -16.1% for 2022.)
Conclusion: 2022 was a horrible year for stocks. Following three excellent years, the real return for stocks was about -25%. That ranks as the fourth worst in my lifetime.
Large Cap is about 80% of the total value of all stocks, and it outperformed smaller capitalization stocks by about eight percentage points in 2022. Large Cap Value stocks outperformed Large Cap Growth stocks in 2022 by more than 30 percentage points; this is basically the opposite of two years ago.
Over five, ten and 15 years, VTSAX – the Vanguard index fund for US Total Stock Market – has outperformed or matched seven of the nine boxes in the 3 by 3 matrix. I’m sticking with my Total US Market fund. (Patti and I own FSKAX.)