Should you overweight to own more small company stocks?
Posted on March 30, 2018

No, you should not overweight your portfolio with Smaller Company Stocks. Just maintain a proper, healthy weight. In Nest Egg Care, I recommend that you own smaller company stocks in proportion to their contribution to the total stock market. That means I like a capitalization-weighted Total Market Stock Fund, one that holds virtually all stocks (e.g., all 3,700 US stocks). That’s going to be about 80% Larger Company Stocks and 20% Smaller Company Stocks. I think holding all stocks simply ensures that you have the broadest representation of all the companies that make up our economy.
A popular and often recommended overweight is to hold more Smaller Company Stocks than their value as a proportion of the total value of all stocks (to hold more than the 20%). One portfolio specifically for retirees that I saw recently recommends about double overweight of Smaller Company Stocks.* Ouch. That really doesn’t make sense to me. This post discusses the reasons why I don’t think you should overweight Smaller Company Stocks.
1. Over the period 1926 to the present, smaller company stocks have outperformed larger company stocks. But this is not true for the last 30 or so years.
I get return data on stocks from 1926 in a book my local library keeps on reserve**: 1) annual returns for the largest 500 companies (S&P 500) – that’s about 80% of the total market capitalization value for all US stocks*** – and 2) annual returns for Smaller Company Stocks – the smallest 20% of the market. (Obviously, the two together represent the Total Market.)
Since 1926 S&P 500 stocks have returned about 7.1% real return per year. Smaller companies have returned about 9.6%. The rate difference compounds to a BIG dollar difference over 92 years. But that difference in return rates is basically accounted for by an explosive period of returns for Smaller Company Stocks from 1975 to 1984. (This is after the steep declines for both Large and Small in 1973 and 1974).
Starting in 1975 Smaller Company Stocks returned an average of 26% real return per year for nine years, compounding to 7.8 times their value at the start of 1975. That’s a steep rise: at an average rate of 7%, it would normally take stocks about 30 years to compound 7.8 times. (Over that period starting in 1975, S&P 500 stocks compounded at 7.5% per year over nine years – not far off their long run average – to 1.9 times.)
Jeremy Siegel in Stocks for the Long Run (Chapter 12) points out that excluding that period starting in 1975, Larger Company Stocks and Smaller Company Stocks returned about the same since 1926.
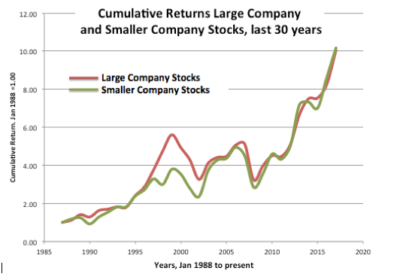
Over the past 30 years, there is no difference in returns between Larger and Smaller Company Stocks. You can see the cumulative change for each over the last 30 years in this graph: both have averaged 7.4% real return Not a bit of difference.
2. Smaller company stocks have greater BAD VARIABILITY than larger company stocks. When we’re retired our big concern is, “Don’t run out of money!” We don’t like BAD VARIABILITY. It’s really BAD VARIABLITY from stocks that is going to get us.
• I repeat data from a table in this post. In all cases shown here, BAD VARIABILITY of Smaller Company Stocks is worse than for Larger Company Stocks.
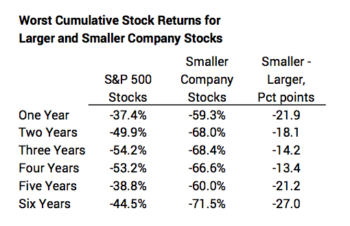
• Real returns for Large Company Stocks have been below 0% in 27 out of the 92 years since 1926. Smaller company stocks were better in 14 of these years, but were worse in 13. Compare: bonds (clearly a different asset class) were better in 25 years and worse in just two.
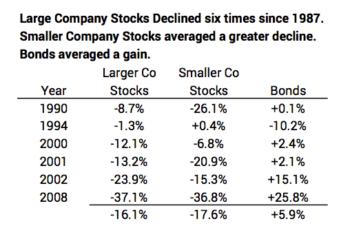
• In the last 30 years Larger Company stocks declined six times. The table shows the returns from Smaller Company Stocks and from bonds in those years. On average Smaller Company Stocks declined more. We Nest Eggers like bonds for their insurance value: their returns averaged 22 percentage points better than Larger Company stocks (+5.9 compared to -16.1%).
Conclusion. You can find recommendations to overweight your portfolio to hold more Smaller Company Stocks, even from some recommended portfolios for retirees. Those arguments hinge on greater returns for smaller company stocks in periods more than 30 years ago and particularly a nine year period from 1975 to 1984. Since then, returns for Large and Smaller Company stocks have basically been the same.
* See article here. You have to look at the details of the mix of stocks and bonds displayed on the bar graph. The stock portion is 64% Large Company Stocks and the 36% Smaller Company Stocks. This is roughly double overweight of Smaller Company Stocks.
Also, this recommended portfolio 55% stocks and 45% bonds. When you follow the steps in Nest Egg Care, you would NOT conclude that you want 55% stocks and 45% bonds as your retirement portfolio.
** Stocks, Bonds, Bills, and Inflation (SBBI) Yearbook. Ibbotson and Grabowski. I site two other sources for return data in this post, but those two don’t display both Large Company and Smaller Company stock returns.
*** 78.6% as of 2012. Stocks for the Long Run, Chapter 7. Jeremy Siegel. The percent of the total will change with the difference in returns of Larger Company vs. Smaller company stocks. Over the last five years (since 2012) Larger Company Stocks have averaged 8.6% per year, and Smaller Company Stocks have averaged 7.2% per year.