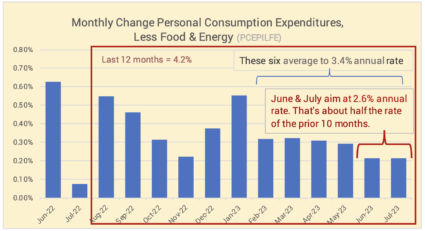
A final data point for inflation in July was issued Thursday morning. The important chart below is the one for Personal Consumption Expenditures, a measure the Fed favors. The rate for both June and July were about half that of the average of the prior two years and aim at 2.4% annual inflation.
Going deeper: below I display a table and the same six graphs that I’ve use to follow the trends in inflation.
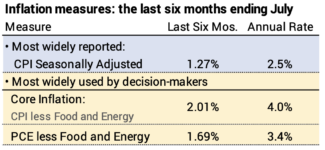
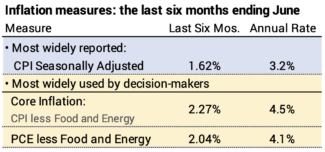
The two most widely-reported measures of inflation are Seasonally-adjusted inflation and Core inflation.
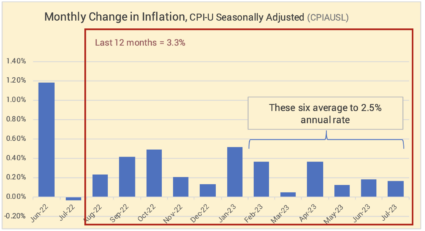
Seasonally-adjusted inflation increased by 0.17% in July. The rate over the last six months translates to an annual rate of 2.5%. Inflation over the past 12 months has been 3.3%.
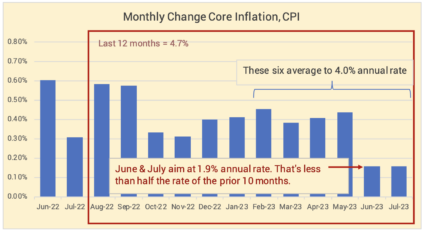
Core inflation excludes volatile energy and food components. This is similar to the measure below favored by the Federal Reserve. June and July are markedly lower than prior months. Inflation increased 0.16% in June and July. These two aim at an annual rate of 1.9% per year, less than half that of the prior 10 months.
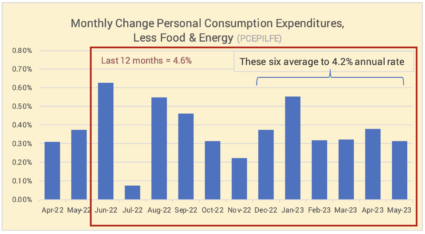
Personal Consumption Expenditures (PCE) excluding Food and Energy is the measure of inflation is one that the Federal Reserve Board favors. The increase this month was 0.22%, almost the same rate in June. These two aim at 2.6% annual inflation.
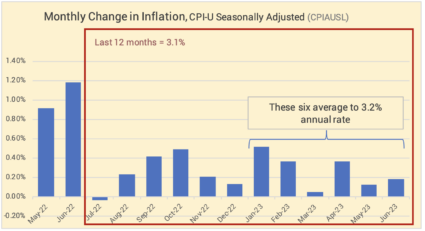
The past 12 months of 3.2% inflation is an uptick from last month: this July ’23 replaced an abnormally low July ’22.
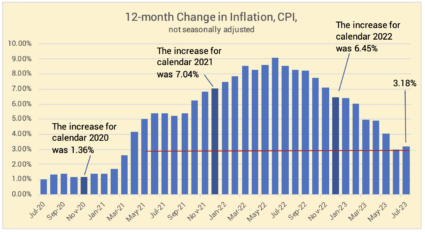
== History of 12-month inflation ==
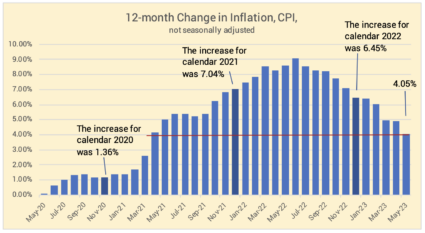
Full-year inflation measured by CPI-U shows that inflation for the last 12 months has been 3.2%. This is slightly greater than the historical results in June: July 2023 was positive while July 2022 was a negative rate.
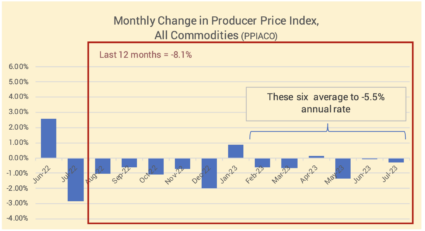
== Producer’s Price Index ==
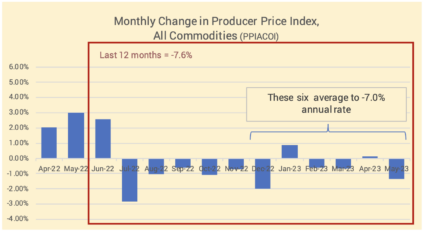
The change in producer prices will impact consumer inflation. PPI over the last six months is at a -5.5%. annual rate.
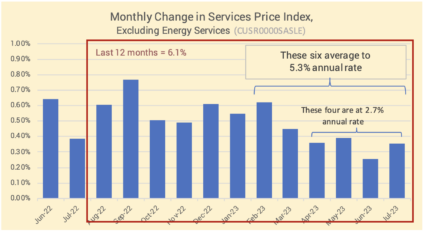
== Services ==
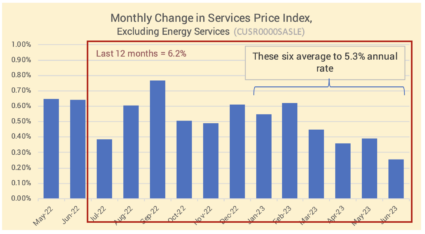
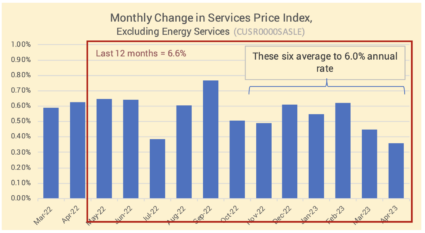
Inflation for services is trending lower. The last four months are at 2.7% annual rate as compared to 6.1% for the past 12.
Conclusion: The Core rate of inflation in July was 0.16%, the same as June; these two months aim at less than 2% annual inflation. The low inflation for July was repeated in the index of Personal Consumption Expenditures, the inflation measure favored by the Federal Reserve; June & July aim at 2.6% annual inflation.
We’re in England right now. Patti and I like active vacations. I like knowing we’re going on a vacation that requires that I am in reasonable shape. Without that goal in the future, I wouldn’t exercise nearly as much as I do. What is that motivates you? What is your exercise routine?
== Walking our my main exercise==
Hiking is our primary daily activity in England. England has over 400,000 miles of walking trails. Years ago, we’d walk more than 100 miles for ten walking days. At my age (78), those days are past. We’ll do day hikes. We aren’t committed to walk every day. The number of miles that are comfortable have declined. I’ve learned to limit elevation gain to less than 1000 feet.
I work to build my endurance for these trips. It was harder this year. Last fall I walked a total of nine miles on several days to prepare for our trip to France. I managed one day at 7½ miles in preparation for this trip, and I was pooped. I set six miles as our comfortable limit in England. One hike that we’ve liked in the past in the Shropshire Hills is six miles. That will be about perfect.
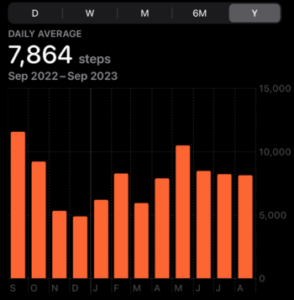
I’ve read that about 7,500 steps per day is good. That’s about 2½ miles – roughly one hour. I almost always take my iPhone, and it counts my steps. My United Healthcare gives me a $10 reward if I walk 5,000 steps for ten days in the month. That’s less than two miles and about 40 minutes. That hasn’t been much of a problem this summer.
I’ve done well over the year, averaging more than 7,500 steps per day.
== What I need to do ==
I no longer the attend the exercise classes that I used go to before COVID. My strength conditioning is not where it should be. I’ve not built a routine. I need to work on that, since some suggest that strength conditioning is more important than walking.
I saw my PCP for my annual wellness visit last month. She tested me for balance. I have to walk a few steps heel to toe and stand with arms out and eyes closed. I’m not good at the heel to toe walk. She suggested that I start balance exercises. I know that’s important. I lost my balance on a steep part of the trail in Japan – for no good reason – and fell. I managed to knock Patti off her feet, too. We weren’t hurt, but the fall was a shock.
Conclusion. As we get older I think we need to exercise regularly to stay in shape. It’s harder for me now that I’m in my late 70s. I use our bigger trips –all are geared to walking – as motivation. I’ve managed to average about 2½ miles per day over the last year, roughly 7,500 steps per day.
My strength and balance training have fallen. I’ve lost the urge to go to the exercise classes that I did before COVID. I’ve got to work on those two.
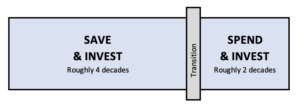
What’s the correct mindset in the Save and Invest Phase of life? That’s up to roughly age 55 or 60. That’s the start of the transition to your Spend and Invest Phase of life that I assume starts at age 65. The focus then is not to outlive our money, and our mindset then must be very different; I’ll discuss the major differences in a future post.
Your objective in your Save and Invest phase of life is to invest with the most reliable chance for More in the future. You want each investment you make to be reliably More when you sell it for your spending. You particularly want to have More near the start of your Spend and Invest phase. That’s going to determine how much you can safely spend from your portfolio for the rest of your life. Follow the advice in this post and you will be in the top ranks of investors in your Save and Invest phase of life. Perhaps only one in 50 will have greater returns than you.
Think that each annual amount you save and invest has a holding period – the number of years you hold on to an investment before you will sell if for your spending. You will have relatively short holding periods and very long holding periods. When you are saving for a down payment on a home in the next five years, your most reliable chance for More – more specifically, your lowest chance for Less – is to keep your money in money market or CDs. No stocks.
The money you contribute to your retirement plan has very long holding periods. You’ll hold each annual amount you save and invest in your 20s for nearly 40 years. You’ll hold the investments you make for retirement in your 30s for nearly 30 years.
Think of the amount you save and invest this year as a gift that you will open many years in the future. You’ll make perhaps 40 gifts up to age 65, and you’ll open those gifts for perhaps 20 years when you are retired.
It’s not precise, but I think it’s simpler to think that all the gifts you make in this phase have a 25-year holding period. The gift you make at age 40 is the gift you will open in your 65th year. The gift you make at age 41 is the gift you will open in your 66th year. And so on.
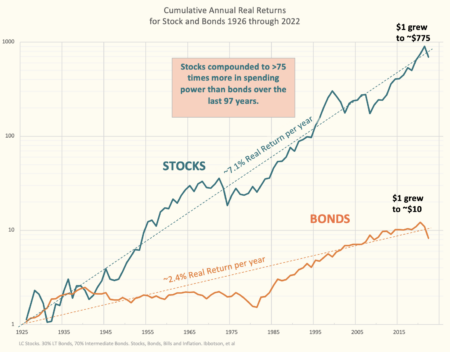
All gifts of 25 years (actually far fewer than 25) must solely be invested in stocks. Stocks are the CERTAIN path to More. Any bonds you hold will result in less in total. Stocks have never declined over 25 years. On average stocks return 3.3 times that of bonds. Bonds have never outperformed stocks in any 25-year holding period; stocks were 10% better than bonds in the 25-year period that bonds came closest to stocks. This description tells the obvious advantage of stocks.
This graph shows to power of compound growth. On average stocks double in real spending power about every ten years. Bonds double in real spending power about every 30 years. Over time, stocks far outdistance bonds.
You will only achieve the results you want by investing in broad-based index funds. You won’t achieve them by trying to beat the market. The results cited assume you match the market returns less a very low expense ratio – the annual percentage costs you incur that is a deduction from gross market returns. Attempts to beat the market – invest in higher cost actively managed mutual funds that tell you that they will outperform, for example – fail in 15 of 16 chances and on average lower the amount you have in the future by about 13%. That’s 13% less per year that you’ll be able to safely spend when retired.
Save in retirement accounts. The benefit of tax-free growth will be about 15% more after taxes. ALWAYS contribute to your employer’s plan to get the FREE MONEY match it may offer. You are doubling your return on that portion of your contribution.
You must tell yourself that you have correctly invested each annual gift. The ride with stocks-only will be bumpy. Bumpy is too kind of a word for some years or periods. Downturns in stocks can be scary. Your intuitive, emotional brain will try to overrule your rational, thinking brain. You must remind yourself that each annual gift is correctly invested for More. My last 35-year gift grew 12.5X in real spending power. It rode through the 2nd and 5th worst one-year declines for stocks in history; the 3rd worst three-year decline; the 3rd longest period of 0% cumulative return for stocks.
You want to be a self-sufficient investor and hold just two broad-based mutual funds and only pay the expense ratio of those two funds. I hold a US Total Stock Market Index Fund (70% of my total for stocks) and an International Total Stock Market Index Fund (30%). Those two own pieces of almost all traded stocks in the world. Those are the only two I will hold for the rest of my life. My total expense ratio is less than .03%. I keep +99.5% of market returns.
Conclusion. With the right mindset you will be in the top ranks of investors in your Save & Invest phase of life. Perhaps only one in 50 investors will have greater returns than you.
The right mindset focuses on investing for reliably More Money for a holding period – the number of years you hold an investment before you sell it for your spending. Important targets – saving for a down payment for your first home – will have relative short holding periods. Your most reliable path to More – specifically, the least chance for Less – is to invest in CDs and money market. No stocks.
The amount you save and invest for your retirement has very long holding periods. Think that you’ll hold the amount you save and invest this year in your retirement account as a gift to the older you. You’ll make perhaps 40 annual gifts up to retirement, you’ll open those gifts over about 20 years in retirement.
All 25-year gifts (and gifts with a lot fewer years) MUST be invested 100% in stocks. Stocks are the CERTAIN path to More. Stocks have ALWAYS increased in 25 years. Stocks have ALWAYS outperformed bonds – 3.3 times more than bonds on average. You can expect annual each gift invested in stocks that you’ll open in retirement will have grown six-fold in real spending power in 25 years.
You must invest in broad-based stock index funds. You will almost certainly fail to beat the results of index funds if you attempt to beat the market: that tactic fails 15 of 16 chances and typically leads 13% less if you held than just held two stock index funds.
My tickler file told me that this is the week to complete my first cut on my tax plan for 2023. This post gives you a template for the spreadsheet I use. It might help you for your tax planning for this year. It’s similar to the one I provided last August.
== It’s important to plan your taxes ==
1. I plan now to estimate how much I will withhold when I take our withdrawals from our IRAs in the first week of December. I pay no estimated taxes during the year. That’s the only time I withhold: I get an interest-free loan during the first 11 months of each year.
2. With some planning you may avoid taxes that you will never have to pay.
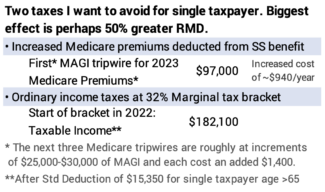
== Two taxes I don’t want to pay ==
• I never want to pay Medicare Premium surcharges that I could otherwise avoid. A tripwire costs us as married, joint filers about $2,000. The tripwires will be half as far away as now when it is just one of Patti or me alive.
• Patti and I will never get close to the 32% bracket while the two of us are alive. But I need to think about this when it is just one of us alive. Greater RMDs then push toward that bracket. The start of that bracket is half of what it is for married, joint filers.
== Our 2023 tax return ==
I start with our Safe Spending Amount (SSA) for 2024. I calcuate that right after my 12-month year ends November 30. I plan to sell the first week of December to our SSA for 2024 into money market. I’ll then use autopay it out to our checking account throughout 2024.
• Our SSA will be the same real amount as last year. I’ll assume now that last year’s SSA adjusts for 4% inflation. The Social Security COLA increase that will be announced in October will be close to this. Our portfolio return is good so far this year (my calculation includes a very poor December 2022), but the return isn’t close to the level that means I’d calculate to a real increase in our SSA.
I have to – basically – earn back more than the decline to calculate to a real increase in SSA. We’re far away from that.
• Our RMD this year is less than last year. Our year-end 2022 portfolio value was about 20% less than year end 2021. That means I will get more of our SSA from greater sales of taxable securities for than last year. Taxable income and gains taxes are a much lower bite out of the total.
• I had a wrinkle this year. I usually sell in the first few days of December to get our SSA into cash for the upcoming year. I didn’t do that last December, since I decided to sell only bonds for our spending in 2024 and sell throughout the year. That didn’t have any real effect on this tax return: bonds had declined so much that I wouldn’t have had taxable gains to report last year, and I won’t repory any by selling this year. Bonds have gained about 3% since last December, so I came out just a little ahead by selling them throughout 2024 rather than then.
• Our estimated Adjusted Gross Income won’t be close to a Medicare Tripwire that we could otherwise avoid. I don’t have to consider selling from my Roth to lower AGI. I will keep that powder dry.
== A future tax return ==
I’m trying to capture what Patti’s tax return will look like when I’m no longer around. I adjust my estimated 2023 tax return for a single tax payer, lower Social Security benefits, and greater RMD – we’re older and I use 50% greater RMD; if you are younger, you should probably look at double RMD. (Read here or here if you are unclear as to why your RMD may double.)
I did that. I have decided not to consider actions now to avoid those two taxes that I hate. I have taken actions in the past. These are the three I have considered. The earlier I do them, the better.
1) Convert traditional IRA to Roth. It makes sense to pay tax now – say at 22% marginal tax – if that avoids a much greater tax – say 32% marginal tax in the future. You keep 13% less at the 32% rate than you do at the 22% rate. Roth also buys you flexibility to avoid Medicare premium surcharges that you could otherwise avoid.
2) Donate from more from IRAs: greater QCD donations. If you give a set amount, shift to give more earlier and less later. This the effect of lowering future RMDs.
3) Withdraw more from traditional IRAs and give the net to heirs for contributions to their IRAs. The effect for you plus them is, basically, no taxes paid. You pay tax but they, in effect, get a tax deduction. The net is zero tax if the marginal tax brackets are the same.
Conclusion. I complete a draft plan for taxes the first week of August. I start this year with my estimate of our Safe Spending Amount (SSA) for 2024. I figure out where I will sell securities to get it, and I estimate total taxes we have yet to pay on our 2023 return. I’ll withhold those taxes when I withdraw from our IRAs the first week of December.
I also do this tax planning to make sure we never cross a level of Adjusted Gross Income that triggers a Medicare premium tripwire that I could otherwise avoid.
I also have to think about a future tax return for a single tax payer – likely Patti’s return when I’m no longer around. RMDs could be 50% greater than now. Medicare premium tripwires and marginal tax brackets start at half of what they are for us as married, joint filers.
A final data point for June inflation was issued this morning. The important chart below is the one for Personal Consumption Expenditures, a measure the Fed favors. June was at a rate of equal to 2% annual inflation; this is lower than in the recent past. The data point confirms the June reading for Core Inflation that I described two weeks ago. One month does not make a trend, but this is a bit of encouraging news. The market is reacting positively today, and July will be a good month for stocks – up about 3%.
Going deeper: below I display a table and the same six graphs that I’ve use to follow the trends in inflation.
The two most widely-reported measures of inflation are Seasonally-adjusted inflation and Core inflation.
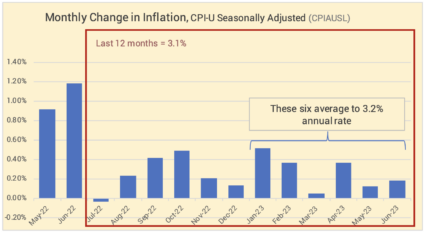
Seasonally-adjusted inflation increased by 0.18% in June. The rate over the last six months translates to an annual rate of 3.2%. Inflation over the past 12 months has been 3.1%.
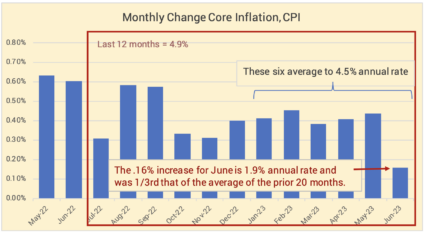
Core inflation excludes volatile energy and food components. June broke with the pattern that was aimed at ~5% inflation. Inflation in June was +0.16% for the month, about a third that of the prior 20 months. June inflation is at a rate of 1.9% per year.
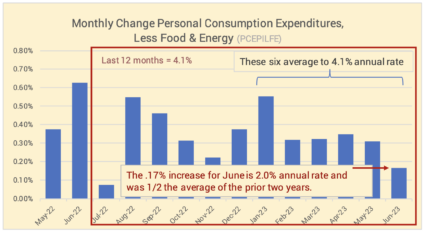
Personal Consumption Expenditures (PCE) excluding Food and Energy was issued this morning. This measure of inflation is one that the Federal Reserve Board favors. The increase this month was 0.17%. This is about half the average of the prior two years. That one month is at a rate of 2.0% per year.
== History of 12-month inflation ==
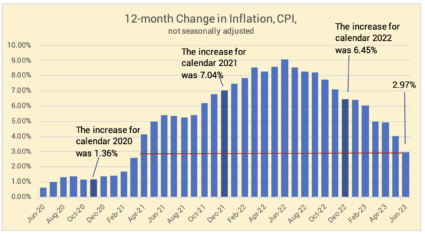
Full year inflation measured by the CPI-U shows that inflation for the last 12 months has been 3.0%. The historical 12-month rate has declined each of the past 12 months from its peak of 9.1% last June.
== Producer’s Price Index ==
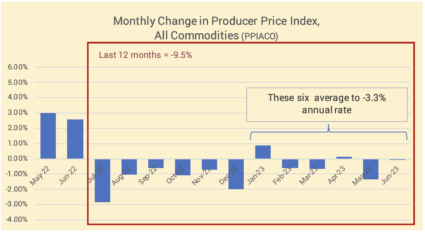
The change in producer prices will impact consumer inflation. PPI over the last six months is at a -3.3%. annual rate.
== Services ==
Inflation for services is trending slightly downward. The last six months are at at 5.2% annual rate.
Conclusion: The Core rate of inflation in June was 0.16%. This was about 1/3rd the average of the prior 20 months. The annual rate of inflation, based on the six recent months of lower inflation is about 4.5%. The low inflation for June was repeated in the index of Personal Consumption Expenditures; inflation in June was about half the average of the past two years.
We saved for retirement to have money for the basics in life and to have money to enjoy life. This post discusses how much Social Security (SS) provides for a happy retirement. We retirees understand. SS benefits alone won’t cut it. We like those reliable monthly deposits that adjust for inflation each year, but SS benefits don’t provide enough for the basics in retirement. All should save for retirement, but many do not. I think more might if they understood how little SS will provide in retirement.
== Why do we want money? ==
I’ve written about this in a number of posts. (Here, here, here, here, and here.) We want money to pay for the basics of living. We want money to spend on the things that make our life happier now and in retirement. We want money to help make our family stronger and more successful. Giving money to others can make us happy.
== SS benefits and the Basics ==
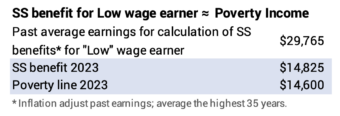
Social Security does not provide enough for what I would consider as basic living expenses. The poverty line in the US for a single adult is income of ~$14,600. That’s for food, rent, utilities, transportation, healthcare costs, clothes, and other basics. The poverty line for two is ~$19,700. Patti and I spend more than $20,000 with property taxes, utilities, and homeowners + health insurance. No food, transportation, clothes, internet or cell phone. Rent here in Pittsburgh averages $1,500 per month or $18,000 per year.
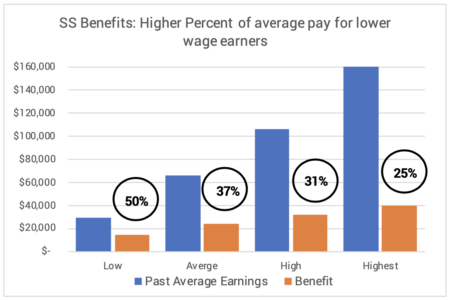
The Social Security benefit for a retiree with “Low” past average earnings of $29,800 – that’s about half the average of the median worker in 2023 – is roughly the poverty line. Benefits replace about half their historical average earnings. I’d assert that those who earned an average of $30,000 per year had almost no capacity to save and invest. All they have is Social Security. It doesn’t look like enough to me. I’m not sure how they make ends meet.
Your SS benefit is a lot less than half of your past average pay. It’s probably closer to 30% of your past average pay – and after taxes it’s likely less than that.
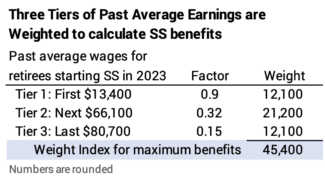
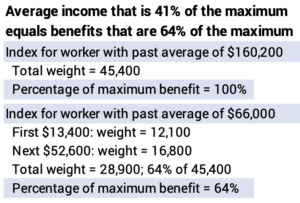
Reason #1: The math of calculating SS benefits tilts toward those with lower past wages. The math to calculate your benefit weights historical past wages in three tiers. For someone who chooses to start SS in 2023, the first ~$13,000 of income has the same weight in the calculation of benefits as does the last ~$80,000 of income. (The maximum subject to SS tax in 2023 is $160,200.)
A person with $66,000 average past earnings who starts SS in 2023 has earnings 41% of the $160,200 maximum subject to tax, but receives 64% of the maximum benefit for his or her age.
Reason #2: Taxes on SS benefits may knock off about 20% of the pre-tax benefit. For Patti and me, 85% of our SS benefits are subject to tax. The effect is that we pay nearly 20% of the benefit back as income tax. If our benefits were 31% of past average earnings as indicated in the graph above, the after-tax benefit is sliced to about 25%.
An IRS worksheet determines the percentage of SS benefits subject to tax. It’s not a straightforward calculation. I explained it here and provided a spreadsheet that helps to understand the calculation. Those with low SS benefits and low income other than SS pay no tax on their benefit. An increasing percentage is taxed until it reaches the maximum of 85%.
Conclusion: Younger folks need to save and invest for retirement. We retirees understand: Social Security alone won’t cut it. Social Security benefits may replace a third of a retiree’s income during their working years. This is not enough for the basic living expenses they’ve gotten used to. And they should want much more than just the basics to be happy in retirement: to pay for experiences they’ll enjoy; to help their family be happier and more successful; to help others.
I read three articles this week saying that we had really good news on inflation. See here, here, here. The market seemed to like this news the past several days. I updated a few of my charts that track inflation. My chart of seasonally adjusted inflation, the most widely reported measure of inflation, did not show that inflation was cooling. Inflation in June was greater than in May. The rate for the last 12-months declined, but we knew that was coming: this June replaced the very high June 22 rate, the highest monthly rate since March 1947.
What was good about the data released on Wednesday? Core Inflation clearly declined: that’s the Consumer Price Index less the volatile food and energy components. It’s been stubbornly high. June was the first big drop in 20 months – roughly 1/3rd May; 1/4th June 2022; and 1/3rd the average of the prior 20 months. One month is clearly not enough for a trend, but the 0.16% increase is an annual rate of less than 2%.
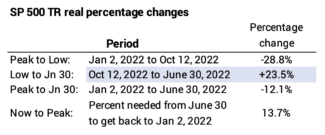
Yes, we are in a bull market. The start of a bull market is generally defined as the point when the market is 20% higher than the previous low. Our previous low was mid-October 2002. We passed 20% higher some day in June. As of June 30, we were roughly 23% above the low. We were not at the previous high in January 2022. We have another 14% or improvement to get back to that point.
It’s important to keep track of progress: we may be on track to rebound much faster than average, which would be very good news. I pointed out in this post that it took an average of seven years for the market to consistently surpass a decline similar to the one we had in 2022.
== Digging deeper: here are the specifics ==
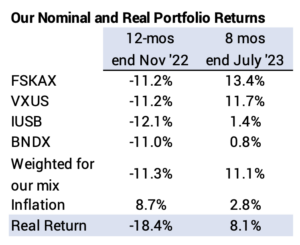
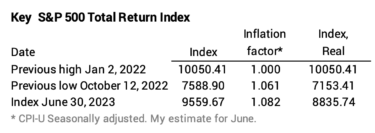
Inflation distorts our understanding, so I adjust the nominal measures of the market for inflation. I use the S&P 500 Total Return Index; that includes the effect of price and dividends reinvested.
The decline Jan 2, 2022 to October 12, 2022 was nearly 29%. The rebound to June 30 has been nearly 24%. We are 12% below Jan 2, 2022. We need about 14% improvement to get back to the Jan 2, 2022 level.
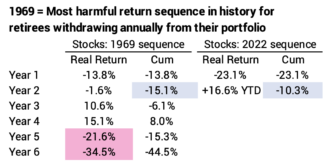
== 2022 vs 1969 ==
Since 2022 was so bad – the fifth worse one-year return for stocks in history – I want to compare it to the most harmful sequence of return in history for a retiree withdrawing from a portfolio each year for spending. That was the sequence that started January 1969.
It’s WAY too early to make a judgment on where the 2022 sequence is headed. The recovery so far this year is encouraging. (l always HATE to look at those stock returns in ’73 and ’74!)
Conclusion: We’re now in a bull market. The market crossed 20% above its prior low in June. We have to improve by 14% to get to the prior high at the start of 2022.
This post shows that we continue to track to 4% inflation, twice the Federal Reserve’s target. The Fed announced this week that we would not see 2% inflation until 2025. That sounds right: recent monthly rates show no trend to 2% inflation. They show no trend to higher inflation. 4% looks rock solid now.
It’s important to track the recent trends in inflation since high inflation is a triple whammy for us retirees. 1) Inflation hurts the ability of companies to earn appropriate returns and grow; real earnings suffer. 2) Stock prices suffer more: the basis for a stock’s price is what the market assumes as the present value of stream of dividends (and stock repurchases). Higher interest rates that come along with higher inflation means the discount rate for that calculation is greater. The present value of the future stream is less. Prices fall. 3) High inflation consumes the spending power of our portfolios. All these factors lower our chances of increased annual Safe Spending Amounts (SSAs, Chapter 2, Nest Egg Care (NEC).
Steady and then declining inflation from a 4% rate has been good for investors. We hit 5% inflation in May 1989, and it took five years to steadly work down to the 2% rate that we enjoyed for more than 25 years. Annual stock returns for those five years were more than triple their long-run average of 7.1% real return per year. The damage comes earlier from increasing and very high inflation, not steady or declining inflation.
Going deeper in this post: I display a table and the same six graphs that I’ve use to follow the trends in inflation.
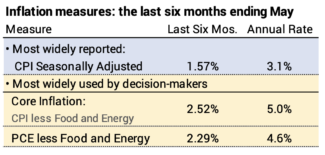
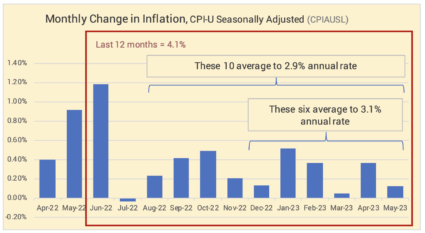
The two most widely-reported measures of inflation are Seasonally-adjusted inflation and Core inflation.
Seasonally-adjusted inflation increased by 0.12% in March. The rate over the last six months translates to an annual rate of 3.1%. Inflation over the past 12 months has been 4.1%. We would expect that historical rate to decline sharply in June: next month’s rate will replace very high inflation in June of 2022.
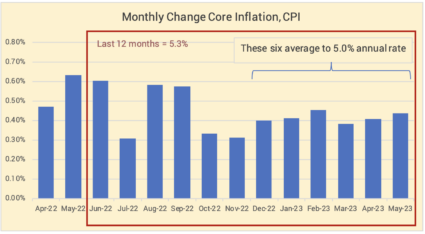
Core inflation excludes volatile energy and food components. The level and trend are more stubborn. Inflation was +0.44% for the month, and inflation for the last six months translates to an annual rate of 5.0%.
Personal Consumption Expenditures (PCE) excluding Food and Energy was issued this morning. This measure of inflation is one that the Federal Reserve Board favors. The increase this month was 0.31%. The last six months equate to 4.6% annual rate.
== History of 12-month inflation ==
Full year inflation measured by the CPI-U shows that inflation for the last 12 months has been 4.05%. The historical 12-month rate has declined each of the past 11 months from its peak of 9.1% last June.
== Producer’s Price Index ==
The change in producer prices will impact consumer inflation. PPI over the last six months is at a -7.0%. annual rate.
== Services ==
Inflation for services is running fairly steadily at +6% annual rate.
Conclusion: The Core rate of inflation in May was 0.4%. The annual rate of inflation, based on the six recent months of lower inflation is about 4%. This is basically unchanged from last several months. Other indicators of inflation are mixed: the producers price index for goods is running well below 0% while the services price index is running in excess 6%. The good news is that inflation is stable and not increasing.
Patti and I have been back three weeks now, and we reflect on what a wonderful experience we had in Japan. It was very different from here. I describe some of the visual, physical differences that I will not forget.
Terrain. Mountains, mountains, mountains. Only 30% of the land is habitable. Japan was formed by tectonic plates slipping underneath another one: volcanos and uplift. The hills are about the steepest I’ve ever seen. It’s like someone took huge sharp shears to cut out the mountain sides. The tops are pointed. Some were so steep, I had a hard time thinking that trees could grow on them. The valleys are narrow. The rivers are pristine. We saw no plains for waving fields of wheat or other crops. Only very small man-made plots to grow rice.
Earthquakes. Japan averages 4 tremors or earthquakes per day. One woke us up the first night we were in Tokyo – pretty violently shaking our bed. That’s the first one we’ve ever experienced.
No really old houses. Volcanic rock – basalt – is so hard that it was not mined or cut into stones for buildings. All old buildings were made of wood. Most all old wooden buildings we saw are reconstructions of buildings that were destroyed by fire. Each has the traditional small open fire for cooking with no stone chimney. The exterior walls of historical homes were a sheet of paper – a thicker, tougher paper than what we have – and NO insulation from the cold.
Typical farm home – now an inn for overnight guests – in village that is a world heritage site. Steep, thatched roof: this area gets about six feet of snow per year.Brook trout roasting over open, charcoal fire in the room where we ate. No chimney.
Population density! 38 million live in Tokyo metro area. That’s about equal to PA, OH and IL combined (5th, 6th, and 7th largest states). 19 million live in the Osaka metro area. It is very dense during rush hour. Very few women are on the streets or subways. Almost all men going to work wore black suits and white shirt; a man in a nice grey sport coat and light blue shirt stood out. Everyone is Japanese. This is a very homogenous population with strict requirements for immigrants: a big virtual wall. Foreign-born workers: 3% in Japan vs. about 18% of in the US. I would think economic growth would be limited by lack of workers. NO (or almost no) obesity: about 3% in Japan vs. about a third in the US.
Incredible infrastructure. The US spends 3.5% of its GDP on military expenditures. Japan spends 1.1%. Much of the difference is poured into infrastructure. The subways and trains are spotless and run perfectly on time. The bullet trains are especially nice.
You get a reserved car and seat on a train. The platform has a marking for your car number, and the train precisely hits the mark for you to get on your car. In the cities, you have a barrier with entrance gates that open when it’s time to board the subway or train – a safety precaution so no one falls on the tracks. Workers keep those barriers spotlessly clean.
A worker is cleaning the barrier on the platform that ensures no one falls on the track. It looked perfectly clean to me before he started.
We had to change from a regular train to a bullet train near Nagano that would take us to Osaka. The train we were to get on pulled in from the east, but it would have to go out the same tracks to then head south. While we were waiting to get on, the seats swiveled 180o so that they would face forward in the new direction.
The roads are in perfect repair. Manhole covers are works of art.
There is NO Litter. There are NO splotches of chewing gum ground into the sidewalks. Our sidewalks in the two shopping areas within walking distance of us look filthy to me, and we likely have 1/20th the foot traffic of Tokyo. The coffee shop I go to is not clean by Japanese standards; I wonder if anyone else notices.
More cigarette butts, litter and chewing gum splotches on the sidewalk on this city street here than I saw in perhaps 15 miles of walking in Tokyo and Kyoto.
Many public toilets are architectural gems with very clean toilets. I don’t think I’ve even seen a public toilet in a city in the US. I think every toilet seat in Japan has a heated Toto washlet. We’ll buy at least one of those!
Conclusion: Patti and I look forward to our travel experiences. We had a wonderful experience in Japan last month. I describe some of the visual, physical differences that I’ll never forget.