What are the chances Index funds will outperform Active funds?
Posted on March 17, 2023
Last week I realized I had not read a recent SPIVA® scorecard report that compares the performance of Active funds to their benchmark index. My prior post on a detailed report was in 2018. I was not looking forward to reading the latest report because the one in 2018 was detailed and hard to digest. The latest report is, too. I was glad to find this report, “Shooting the Messenger” with a clearer story. I summarize how Actively managed funds compare to their peer benchmarks, and I summarize key reasons why Index funds will outperform Active funds 15 out of 16 times. This discussion is fresh, but similar to that in Chapter 6, “You Must Be Low Cost,” Nest Egg Care.
== S&P Global and SPIVA® ==
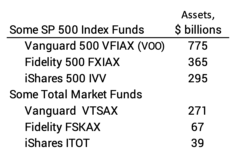
SP Global publishes indices of stock performance. They license use of the indices largely to mutual funds. Their best known and most widely used indices are the Dow Jones Index and the S&P 500 Index. Fidelity builds its US Total Stock Market fund (FSKAX) to track the S&P Total Market Index. ITOT is an ETF from iShares built to track this same index.
Twice a year S&P Global publishes a report called SPIVA®: S&P Index Vs. Active funds. They have now tracked relative performance of Index vs. Active for more than 20 years. This video is excellent on the process they follow to construct the reports. This video highlights the findings in the “Shooting …” report.
== Index funds now about 30% of the market ==
About 25% to 35% of the value of all stocks are held by Index funds. 17% of the value of the stocks in the S&P 500 are held by Index funds tracking that Index. The S&P 500 stocks were 85% of the total value of all stocks at the end of 2021. That means that ~15% of the total value of all stocks are held by S&P 500 Index funds: 17% times 85%. Other index funds hold those stocks and other stocks. For example, I hold all those 500 stocks in my US Total Stock Market Index fund; total market index funds are much smaller than S&P 500 Index funds. S&P Global estimates that all other index funds own another 10% to 20% of the value of all US shares.
== Fewer than 1 in 16 of Active funds outperform ==
S&P Global categorizes a fund by its style – e.g., US Large Cap Growth – and compares the fund’s performance to its benchmark index over time. Active funds rarely outperform their benchmark in a year. The percentage that fail to outperform is worse with more years. Over a 20-year period about 6% Active funds outperform their benchmark index. This is true for Large Cap fund, Mid Cap funds, and Small Cap funds. Some argue the Mid Cap and Small Cap are less efficient and Active should shine. This has not been the case. If 6% outperform, that’s the same as 1 in 16 chance. The converse is the Index will beat the peer Active fund 15 of 16 times.
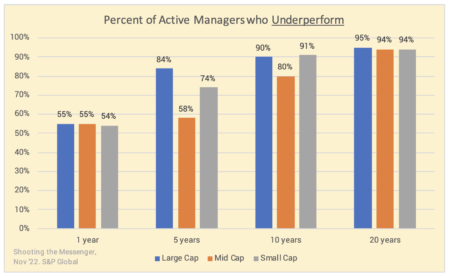

Results would be worse for an individual investor who almost certainly will hold more than one Active fund. One Active fund has a 1 in 16 chance of beating its peer index funds. A second Active fund has a 1 in 16 chance of beating its peer index fund. When you hold, say, five Active funds, you almost have no chance of the combination outperforming.
S&P Global is not comparing Active funds to Index funds, but I assume one can ignore the small expense ratio of Index funds relative to their peer benchmark. That small cost and possible tracking errors are more than offset by the cost in after-tax return from far greater capital gains distributions by Active funds that I described last week.
== They don’t manage volatility ==
Active managers do not manage portfolio volatility. They underperform roughly 95% of the time in down markets and 95% of the time in up markets.
== Almost no persistence ==
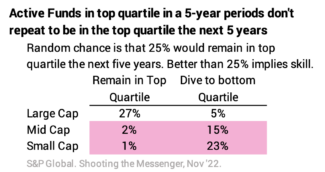
Judging skill based on history is a lousy yardstick. You’d think that a significant portion of funds that were in top 1 in 4 (top quartile) over a five-year period were more skilled. If they were skilled, a high percentage would remain in the top quartile the next five years. Random or no skill would be that 25% would repeat the next five years.
Just 27% of large cap funds stayed in the top quartile five years later, implying a tiny bit of skill. The case of mid and small cap funds, the case for no skill is pretty clear. Very few in the top quartile for five years remain in the top quartile the next five years. The worst: just 1% of small cap funds at the top for a five-year period repeated the next five years, and almost one-fourth dove to the bottom quartile. How dismal!
== Why does indexing work? ==
The report mentions a number of reasons. I focus on three here.
1. It’s a zero-sum game. Any outperformance has to come at the expense of those who underperform. The return for the aggregate of all investors before consideration of costs is the same. Index funds, before costs, clearly earn market returns – these funds own stocks in proportion to match an index; they may have small tracking errors, but these tend to be really small. The aggregate of all other investors also must earn market returns before consideration of their costs. That’s the simple math.
2. The targets for underperformance have shrunk and continue to shrink. In the 1970s, there were two targets for underperformance: individual, amateur investors and poor performing professional managers.
• Individual investors no longer can provide enough underperformance. In the late 1970s and 1980s Active fund managers made the case that they would accrue the underperformance of individual investors. Many studies showed individual investors decided what and when to buy or sell emotionally and underperformed the market. I remember a market indicator that said if individual investors were buying, it was a good time to sell, and vice versa.
I don’t find good data, but 50 years ago I’d guess that more than 50% of the market value of stocks was held by individual investors. That’s a hefty target of potential underperformance.
The landscape is completely different now. Individual investors who pick their own stocks have largely gone by the wayside as measured by the total value of stocks they hold. I estimate that only 5% of the value of stocks are held by individuals making their own investment decisions. (Their trading volume is greater than that.) Professionals dominate and hold, in effect, 95% of the value of US stocks. That 5% isn’t a big enough source of underperformance for the 95% professionals to argue that they can outperform.
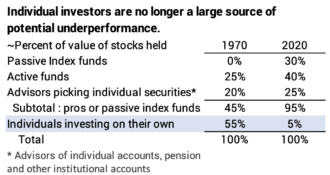
• A better and better set of professional investors makes it harder and harder for an individual professional investor to beat other professional investors. Investors in Active funds didn’t have comparative benchmarks 50 years ago. Today, investors can see how an Active fund or an advisor performs relative to peer peer indices or index funds. The pros who don’t match up find that investors flee and move capital out of their fund to invest elsewhere. They become smaller players or disappear. The remaining set of hard-working, smart professionals are the more successful ones, and they are battling other successful, hard-working and smart professionals.
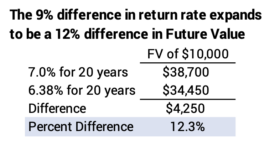
3. Active funds and advisors can’t overcome their added costs. This is the most powerful argument. Before costs the aggregate returns for Index funds and Active funds and advisors will be the same. The average expense ratio for an Active fund in 2021 was 0.68% and was 0.06% for an Index fund. (Advisor fees would be an added cost.) The aggregate of Active funds must underperform Index funds – return less to their sharehoders – by the difference in their costs, 0.62 percentage points in the year.
Assuming real stock returns of about 7.1% per year, the added cost is consuming about 9% of the growth rate (0.62%/7.1%). In 20 years, that return difference results in a greater dollar difference in the value to an investor after about 15 years. If one pays an advisor in addition to these fund expenses, lowering the net return rate, the effect would be worse.
Conclusion: S&P Global regularly issues SPIVA® reports that compare the performance of Active funds vs. their benchmark index. They now have data for 20 years. Over 20 years, you win in ~15 of 16 times with Index funds: about 94% of Active funds underperform their benchmark index. Active funds underperform about 95% of the time in up markets and in down markets. Past results are a poor guide to future results: for small cap funds, the worst example, only 1% of funds that were in the top 1 in 4 (top quartile) of funds over a five-year period repeated the next five years, and almost 25% dove to the worst 1 in 4 (bottom quartile) the next five years.
Active funds fare poorly against their benchmark index for three reasons:
1) It’s a zero-sum game; outperformance only comes from another’s underperformance.
2) The sources of gross underperformance have dwindled. Fifty years ago, the argument was that fund managers would accrue the underperformance of individual investors who bought and sold individual securities. The landscape has changed; buy-sell decisions are dominated by professional investors, and individual investors likely hold less than 5% of the total value of stocks.
3) The cost of an active fund in 2012 was 0.68% of assets invested as compared to 0.06% for the average index fund. Active funds in aggregate have to return 0.62 percentage points less return to their investors than Index funds. That’s about 9% of the future growth rate, assuming the expected real return rate for stocks is 7.1%: 0.62/7 = 9%. That difference in return rate expands to a bigger difference in the value of an investment for holding periods greater than 15 years.