What’s does the latest SPIVA® report on Actively Managed funds tell us?
Posted on June 15, 2018

You’re retired. You can’t waste money. You want to keep the most you can from future market returns. You can pay more (greater Investing Cost) to try beat the market. Or, you can reliably keep almost all of what the market gives – but with no prospect of ever beating it – by investing in low cost Index funds. A decision to spend more in an attempt to beat the market is a very bad (perhaps dumb) choice. Only invest in Index Funds: reliably keep just a shade less than overall market returns.
This post summarizes a recent SPIVA® Scorecard. (You can see and download the report here.) The report shows that over the long haul, about 94% of Actively Managed funds fail to beat their benchmark index. Only a fool would build a retirement plan betting on the ability to pick the 1 in 20 that manage to beat an Index Fund. (As background, this post explains why, in aggregate, Actively Managed funds MUST underperform Index funds.)
What’s an Actively Managed fund? An Actively Managed fund employs a fund manager (company) that actively buys and sells securities to pick winners and avoid losers in an attempt to outperform. These funds have relatively high Expense Ratio, largely due to pay to their highly compensated investment managers and, perhaps, commissions they pay to those who hawk the funds to investors.
What’s an Index fund? An Index fund simply works to mirror or match the aggregate change in total value of the set of stocks or bonds contained in an index. The typical index (and therefore Index fund) holds an amount of each security in proportion to its market capitalization value relative to the total for all the securities in the index. (Market capitalization value is share price times number of shares.) Index funds don’t try to beat the market, don’t trade securities, and have very low Expense Ratio – typically about 1/20th that of an Actively Managed fund. Because of the low Expense Ratio (My Expense Ratio for my largest holding – a US Total Stock Market fund – is less than .04%.), an investor keeps about 98% of what the market gives all investors before costs.
A number of companies use stock performance data to build indices that they sell to mutual fund companies and other investors to use as benchmarks of performance. The granddaddy of these market capitalization indices is the SP 500® Index. It contains 500 largest companies that total about 80% of the total market value of all 3,500 US stocks. S&P Dow Jones Indices, LLC provides that index and many more. (CRSP is an example of another provider of indices; Vanguard uses CRSP indices as benchmarks for many of its funds. See the wiki entry here.)
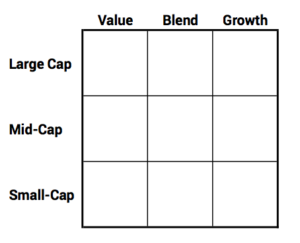
The indices for the US that are most helpful benchmarks fall into the style box below. Other services analyze the holdings of an Actively Managed fund and characterize its category or cell in the style box (The detail in the SPIVA report describes how this is done.)
========
Here are my takeaways from the 33-page SPIVA report. It compares the performance of just Actively Managed funds relative to their benchmark index; the report does not include Index funds. (A previous post described the report for the period ending June 30, 2017.)
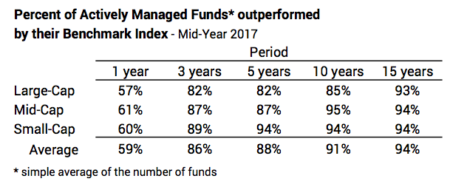
1. Over a 15-year period, about 94% of all Actively Managed funds failed to outperform their benchmark index. You can see below the percent that failed to outperform their benchmark index for different periods. I’m amazed at the high percentage – roughly 85% – that fail to outperform in just three years.
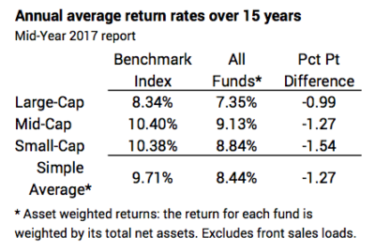
2. Actively Managed funds return perhaps 1.2 percentage points less per year than their peer benchmark index. (This 1.2 percentage points has to be very close to the aggregate annual Expense Ratio for Actively Managed funds over this time period.)
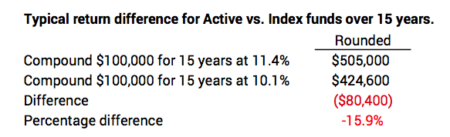
A deficit of 1.2 percentage points per year over the last 15 years compounds to roughly 15% fewer dollars for all those who invested in Actively Managed funds. Wow! (You’d have less if you also pay advisor fees.)
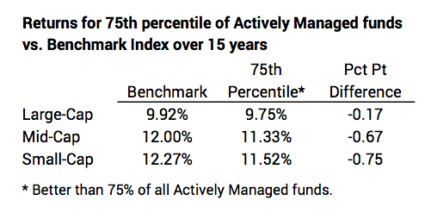
3. Even if you were able to pick the Actively Managed fund that performed at the 75th percentile of all Actively Managed funds (performance that is better than 75% of all Actively Managed funds), you’d be well below the benchmark index.
4. Hold Index funds, and you will be in the top 6% of all investors.* That’s all we have to do. We can’t truly own the Index used in these comparisons, but our Expense Ratio is so small (less than .04% in some cases), that we essentially are receiving the index return.
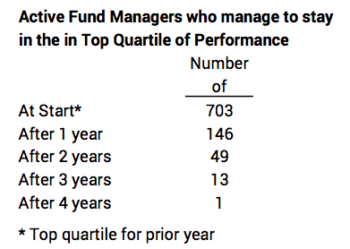
You can see how hard it is to pick a winning Actively Managed fund that consistently remains in the top quartile of funds over time. I construct this table from data you’d see at the SPIVA web site.
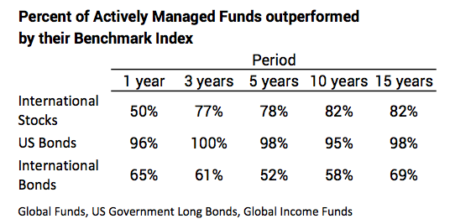
5. What holds true for US stocks (and that will be your largest holding) also applies to International stocks and US and International bonds. Here is a snapshot.
Conclusion: You’re retired. Don’t waste money. Paying high Investing Costs for Actively Managed funds means (with very high probability) that you’ll keep significantly less of what the market will give. You are simply throwing money away. Don’t try to beat the market. Invest solely in Index Funds. You will keep about 98% of what the market will give investors, and you will be in the top 6% of all investors over time.*
* You’d actually be better than this. An Active investor owns more than one fund. The more he/she owns, the overall return will gravitate to the average 1.2 percentage point deficit per year. It’s a remote statistical probability that an investor with as few as four Actively Managed funds can have an overall result that outperforms an Index fund investor.