This post shows that we continue to track to 4% inflation, twice the Federal Reserve’s target. The Fed announced this week that we would not see 2% inflation until 2025. That sounds right: recent monthly rates show no trend to 2% inflation. They show no trend to higher inflation. 4% looks rock solid now.
It’s important to track the recent trends in inflation since high inflation is a triple whammy for us retirees. 1) Inflation hurts the ability of companies to earn appropriate returns and grow; real earnings suffer. 2) Stock prices suffer more: the basis for a stock’s price is what the market assumes as the present value of stream of dividends (and stock repurchases). Higher interest rates that come along with higher inflation means the discount rate for that calculation is greater. The present value of the future stream is less. Prices fall. 3) High inflation consumes the spending power of our portfolios. All these factors lower our chances of increased annual Safe Spending Amounts (SSAs, Chapter 2, Nest Egg Care (NEC).
In my view, 4% is not that high of rate. All of us retirees have lived through almost two decades, in total, with inflation greater than 4%.
Steady and then declining inflation from a 4% rate has been good for investors. We hit 5% inflation in May 1989, and it took five years to steadly work down to the 2% rate that we enjoyed for more than 25 years. Annual stock returns for those five years were more than triple their long-run average of 7.1% real return per year. The damage comes earlier from increasing and very high inflation, not steady or declining inflation.
Going deeper in this post: I display a table and the same six graphs that I’ve use to follow the trends in inflation.
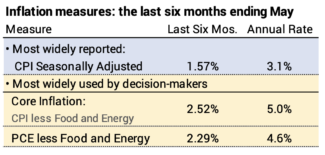
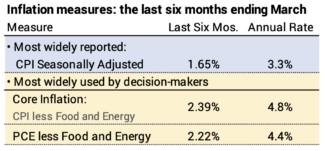
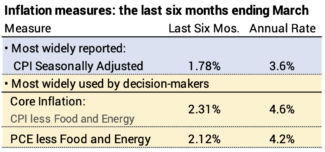
The two most widely-reported measures of inflation are Seasonally-adjusted inflation and Core inflation.
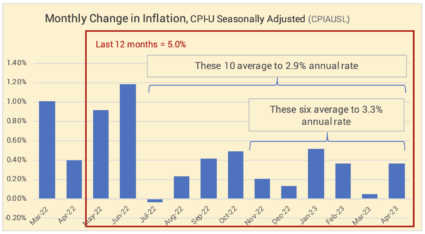
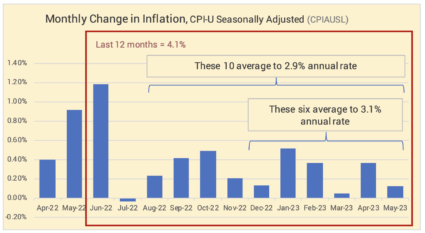
Seasonally-adjusted inflation increased by 0.12% in March. The rate over the last six months translates to an annual rate of 3.1%. Inflation over the past 12 months has been 4.1%. We would expect that historical rate to decline sharply in June: next month’s rate will replace very high inflation in June of 2022.
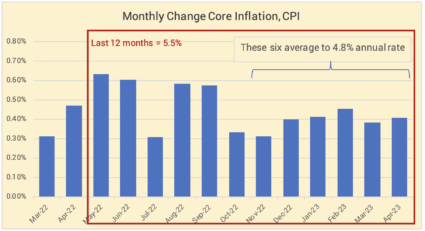
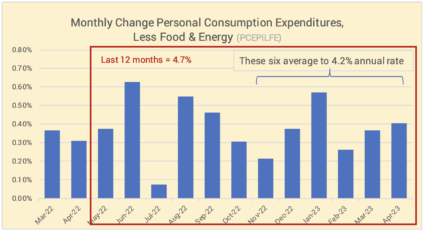
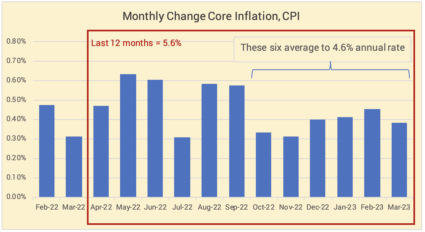
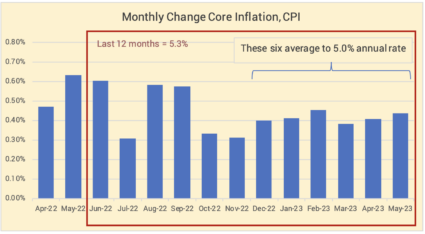
Core inflation excludes volatile energy and food components. The level and trend are more stubborn. Inflation was +0.44% for the month, and inflation for the last six months translates to an annual rate of 5.0%.
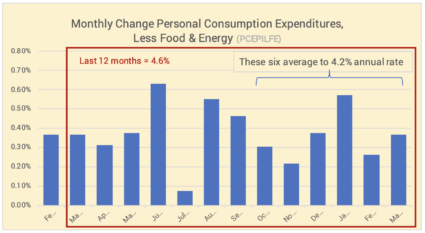
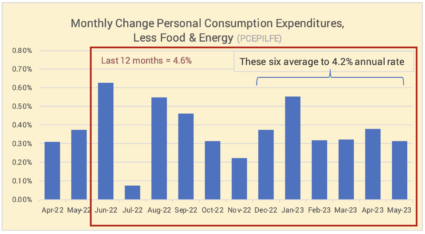
Personal Consumption Expenditures (PCE) excluding Food and Energy was issued this morning. This measure of inflation is one that the Federal Reserve Board favors. The increase this month was 0.31%. The last six months equate to 4.6% annual rate.
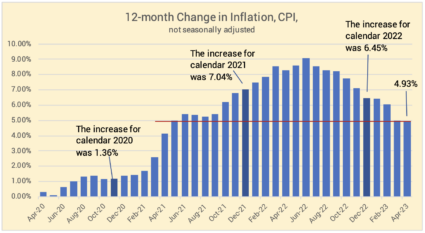
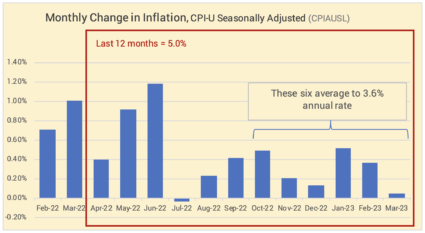
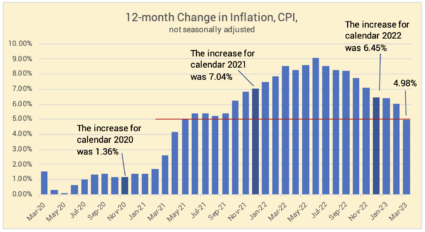
== History of 12-month inflation ==
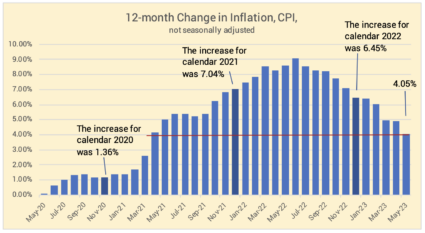
Full year inflation measured by the CPI-U shows that inflation for the last 12 months has been 4.05%. The historical 12-month rate has declined each of the past 11 months from its peak of 9.1% last June.
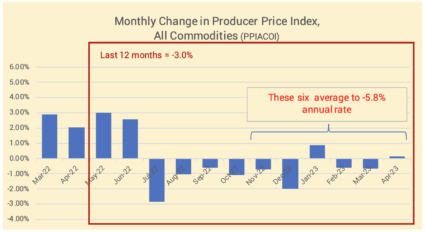
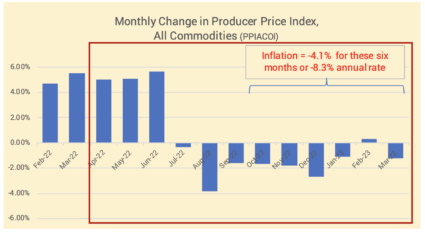
== Producer’s Price Index ==
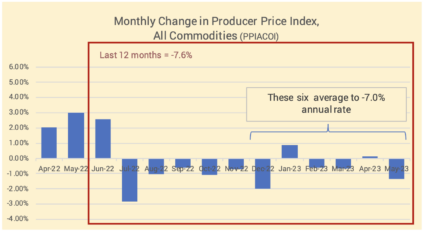
The change in producer prices will impact consumer inflation. PPI over the last six months is at a -7.0%. annual rate.
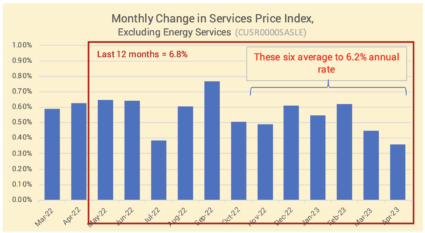
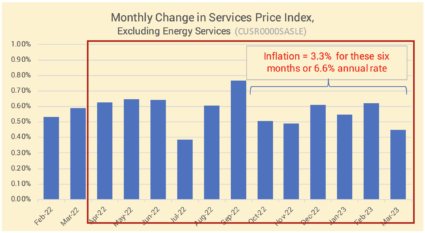
== Services ==
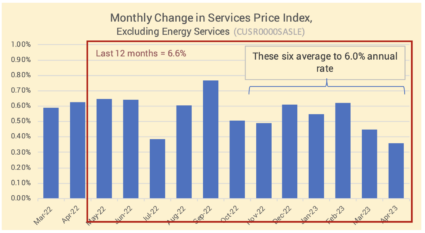
Inflation for services is running fairly steadily at +6% annual rate.
Conclusion: The Core rate of inflation in May was 0.4%. The annual rate of inflation, based on the six recent months of lower inflation is about 4%. This is basically unchanged from last several months. Other indicators of inflation are mixed: the producers price index for goods is running well below 0% while the services price index is running in excess 6%. The good news is that inflation is stable and not increasing.