What percent of investors are self-reliant – confident enough to make their own investment decisions?
Posted on April 21, 2023
This post summarizes data from the ICI Factbook 2022 that I mentioned last week. Retail investors like you and me are 94% of the capital invested in mutual funds and Exchange Traded Funds (ETFs). Index funds are now almost half the total invested in funds. Equity-only index funds account for 16% of the total value of US stocks. The expense ratio of equity-only index funds is less than one-tenth that of actively managed funds. Investors in index funds keep about 99% of the future growth of stocks, while investors in actively managed funds keep about 91%. Only about 40% of investors are confident enough to make their own decisions as to which mutual funds or ETFs to buy outside of their retirement plan; 60% rely on an advisor to make those decisions.
== ICI factbook 2022 ==
This is a 250-page annual report from the Investment Company Institute (ICI). The report was issued May 2022 and includes data as of 12-31-2021. The data is self-reported from most all 16,000 US investment companies. The data in the report is >98% of industry assets.
ICI divides registered – regulated – investment companies into four groups. 99% of the assets are in a total of 11,500 open-ended mutual funds and Exchange Traded Funds (ETFs). For perspective, there are a total of about 22,000 traded securities in the US: about 4,400 stocks and about 18,000 corporate bonds and US-government notes and bonds.
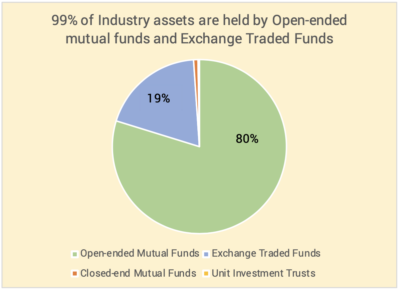
An open-ended mutual fund issues new shares at day-end Net Asset Value for new $$$ invested and retires or redeems shares for $$$ withdrawn by investors. Exchange Traded Funds are mutual funds and create and redeem shares in line with new $$$ invested but not on a daily basis; ETF shares trade on stock markets throughout the day.
Closed-end mutual funds issue a fixed number of shares that trade on stock markets, similar to EFTs; they are the forerunners of ETFs. Unit Investment Trusts are similar to closed-end mutual funds; they issue a fixed number of shares but have a fixed termination date after which proceeds from its sale of securities are distributed to shareholders. These two are about 1% of the total assets of the four types of registered investment companies; that percentage is declining over time.
== Who invests; who doesn’t ==
Retail investors like you and me account for 94% of the assets invested in stock and bond funds. The other 6% is institutional investors: financial corporations – insurance companies and banks are examples; non-financial corporations; non-profit corporations – university endowment funds are an example; state or government employee pension funds; and others.
Money market funds are 14% if the total invested in US investment companies. Of the balance, about 75% is in equities (US = ~75% and International = ~25%) and 25% is in bonds.
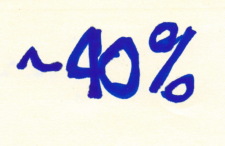
== Self-reliant just 40% ==
The report shows that 40% the value of mutual funds held outside of retirement accounts was purchased directly from fund companies or through discount brokers, such as Fidelity, Vanguard, or Schwab. 60% of purchases were though advisors.
== Funds equal 32% of all stocks ==
US mutual funds and ETFs account for 32% of the value of all US stocks; about 24% of the value of all US and International bonds; 12% of US Treasury notes and bonds.
That means 68% ownership of US stocks is not held in registered funds (and 76% of the value of US and International bonds; 88% of US Treasury notes and bonds). Other investors build their portfolios with direct investment in stocks (and bonds):
• financial corporations such as banks and insurance companies
• non-financial corporations: Berkshire-Hathaway is a prime example
• non-profit corporations and other entities such as university endowments and state or school employee pension funds.
• hedge funds hold about 10% of the value of all US stocks
• individuals
== Index funds increasing share ==
The Index funds are an increasing share of the total invested in funds. Index funds are 43% of the total assets invested and actively managed funds are 57%. The 43% for index funds is more than twice that a decade ago.
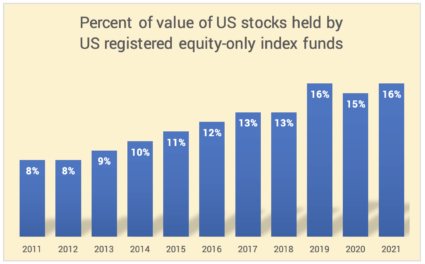
16% of the value of US stocks is held by US-regulated, equity-only Index funds. This percentage has doubled in the past ten years.
== Index expense ratio is <1/10th ==
The weighted-average expense ratio of equity-only index funds was 0.05% at the end of 2022. (Data for 2022 from here.) (My broad-based FSKAX is 0.015% expense ratio.) This is less than 1/10th the weighted-average for actively managed funds, 0.66%. Expense ratios for both have declined over time.
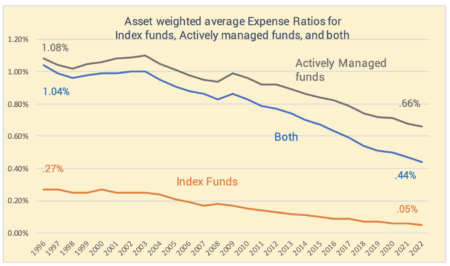
Assuming the expected return for stocks is 7.1% real return rate, investors in Actively managed funds are giving up about 9% of future growth as fees (0.66/7.1), while investors in Index funds are giving up less than 1% of future growth as fee (.05/7.1).
== Load fees ==
Some mutual funds are sold by advisors with loads are fees that provide a commission to the advisor. Funds with loads were 8% of all new $$$ invested in 2021 and was 48% of all new $$$ invested in 2000. Most advisor-brokers now are fee-only rather than commission (load) based.
Conclusion. I summarize the 250-page ICI Factbook 2022. This reported on data ending December 2021. We “retail” investors invest in mutual funds and ETFs. Index funds are almost half that invested; they have grown at the expense of actively managed mutual funds. US equity-only index funds hold 16% of the value of the US stock market; this is an increase from 8% a decade ago. The expense ratio of both Index and Actively managed funds has declined over time. The expense ratio of index funds is less than 1/10th that of actively managed funds. Investors in index funds keep about 99% of market returns. Investors in actively managed funds keep about 91% of market returns. About 40% of investors are confident enough to be self-reliant, directly investing in a fund from the fund company or from a discount broker; 60% incur the cost of an advisor to make the choices.