How long might it take for stocks to recover?
Posted on November 4, 2022

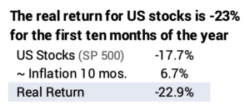
For the ten months of 2022, the real return for US stocks is about -23%. If this is result for the whole year, 2022 would clearly rank in the worst ten years since 1926 and close to the worst five. This is not a different conclusion that I mentioned in this post. The purpose of this post is to look at the 20 worst years for stocks since 1926 and find out how many years it took them to recover. It’s more years than most folks think. It’s clearly more years than we retirees would like. On average it took seven years for stocks to recover.
An average of seven years from a major decline like this year is tough news for us retirees. We’re hard on our portfolio, since we sell from our portfolio each year for our spending. Our upcoming withdrawal will just magnify the decline this year. We make it harder for our portfolio to recover to the point where we would calculate a real increase in our Safe Spending Amount (SSA; Chapter 2, Nest Egg Care [NEC]).
== We’ve all done well in the past decade or so ==
We all have had a great run for the 13 years since the last really bad year for US stocks in 2008. Through 2021, stocks averaged about 13.5% real return per year, well above their long-run average of 7.1% per year. Those increases meant we all had more portfolio value at the end of last year than at any time in our life.
You portfolio likely grew more than it did for Patti and me. You may have started your withdrawals for spending later than we did. You may be younger than we are, and your Safe Spending Rates (SSR%s; Chapter 2, NEC) are lower than ours: you’ve withdrawn less than we have since our first withdrawal in December 2014. Assuming you’ve invested close to our mix of stocks and bonds, you’ve seen more growth in your portfolio than we have.
As a point of referece – if you don’t track your history in as much detail as I do –your portfolio value HAS TO BE at at least 25% greater in real spending power at the end of 2021 than it was at the end of 2015. At the end of last year, Patti and I had 27% more portfolio value, measured in real spending power, than we started with in December 2014, and we almost certainly have withdrawn more than you have. I annotate our calculation sheet from last December to highlight the real change in portfolio value and the total that we’ve withdrawn for our spending.
It will be tough to calculate to a real increase in the future. The market has to rebound mightily, and it always has. But the average time to rebound, measured in real spending power, is much longer than most folks think. I am not optimistic about a fast recovery that will lead to a real increase in our calculated SSA in the future. We may be adjusting only for inflation for many years.
== Ten worst years: seven years to recover ==
I display real – inflation-adjusted – US stock returns for the ten worst years 1926 through 2021. That’s 96 years. Three most horrible years round to -37% real return: 1931, 1937 and 2008. We’ve had two back-to-back years with both in the worst ten: 1930-1931 and 1973-1974.
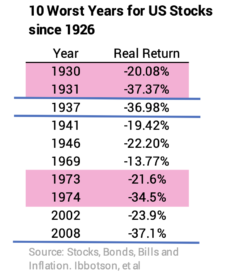
I rearrange the table to display the years starting with the worst in 1931. I also show the number of years it took for stocks to recover – the number of years it took for stocks to get back to their initial value and improve from there.

• These ten are the worst ~10% out of 96. We could say, that based on history, we have a one-in-ten-year chance of experiencing -14% or worse real return for US stocks. The worst five are the worst ~5 percent. We could say we have a one-in-20-year chance of -24% or worse real return. A -23% real return for 2022 would be right on the edge of a one-in-20-year bad event.
• Recovery ranged from 2 to 14 years. It took more than 10 years to recover for three years: 1937, 1969 and 1973.
• It took seven years, on average, for stocks to recover.
== Next ten: also average 7 years ==
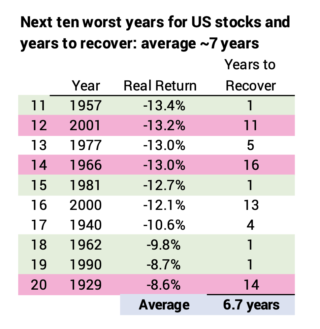
I show the next ten worst years in order. The average recovery period also was ~7 years. It took only one year to recover for four of those years. Three had recovery periods greater than ten years. The longest recovery period in history was 16 years.
Conclusion. This post displays the 20 worst years for US stock returns. This year is on track to easily be in the worst ten and maybe in the worst five. This post also displays the number of years it took for stocks to recover – to get back to their initial level in real spending power and improve thereafter. On average, it took stocks seven years to recover. That’s longer than most folks think and is certainly longer than we retirees would like. It’s going to be tough for stocks to bounce back to a level that results in our calculating to a greater real Safe Spending Amount in the future. We may have to stick with the same real Safe Spending Amount in the future, only adjusting each year for inflation.