Where might this year rank in returns?
Posted on July 22, 2022
I don’t need to tell you: stocks have nosedived. Bonds usually work as insurance, meaning their returns have averaged 27 percentage points better than stocks when stocks crater. Bonds clearly aren’t providing their historical value: they’ve nosedived, too, and are only 8 percentage points better than stocks. This post displays the possible rank of 2022 among the 15 worst years for stock and bond returns since 1926. It shows that 2022 would rank as the fifth worst year just based on the YTD results. NOT GOOD.
The returns have to be disturbing if you’ve recently started on your retirement plan; it’s less disturbing when you look back over the past several years: even with this sharp drop, all of us have experienced above average returns over the past 3½ years.
My worry-point is ~19 weeks from now. That’s when I’ll sell securities for our spending for 2023. Hopefully both stocks and bonds recover. I’m remaining calm – for now.
== Returns so far this year ==
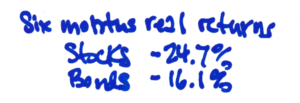
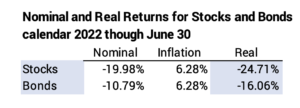
I’ll use the real return for an index fund for S&P 500 stocks (VFIAX) through June: -19.98%. (The return as of yesterday is better.) I’ll use an index fund that basically is an intermediate bond fund (IUSB) through June: -10.79%. The six-month inflation rate has been 6.28%. Real returns for the first six months are -24.7% for stocks and -16.1% for bonds.
== How would this compare? ==
I assume full year results equal the six-month results. That means no improvement or further decline for the balance of the year. I then compare that pro forma result to the worst 15 years since 1926. I pick the results of a portfolio mix of 80% stock and 20% bond to display and rank the years.
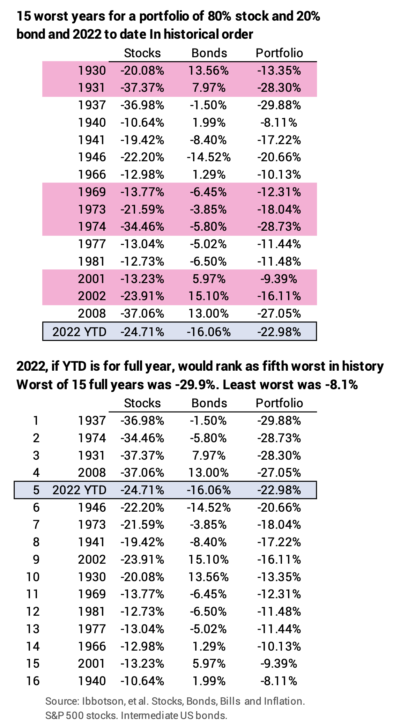
One horrible year certainly is not good, but what really sinks a portfolio is a grouping of really bad years. I highlighted the start of the three most harmful sequences of return: they all started with a year that ranks in the worst 15. The worst of the three is the sequence that starts in 1969. That sequence is the worst-case scenario that drives your Safe Spending Rate (SSR%. Chapter 2, Nest Egg Care [NEC]) to a low level.
If one just looked at stocks, my pro forma 2022 would rank fifth worst since 1926. Bonds would rank as worst on this list. The stinky bond returns so far this year follow smelly real returns for 2021: -8.9% real return; the combination of the two years would be -23.5% real return. That’s the worst in history. The next worst two-year period for bonds was -20.9% (1946 and 47).
== If you’ve just started your plan ==
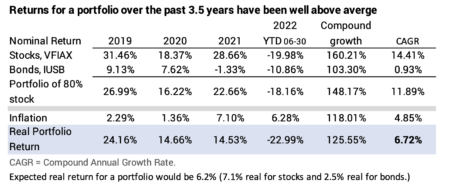
Results so far have to be disturbing if your just started your plan – you made your first security sales/withdrew in late 2021 for your 2022 spending from your nest egg. However, we all can look back a couple of years and be less upset because stock returns were outstanding in 2019, 2020 and 2021. Portfolio returns, even with this decline, are about one-half percentage point greater than we would expect based on long-term average returns.
I can’t predict the results for the balance of the year. Returns obviously have to be pretty darn good for the rest of 2022 to not rank in the 15th worst of the 97 years since 1926.
Conclusion: Both stock and bond returns have been very poor for the first six months of the year. If the YTD returns turned out to be the 2022 full-year results, the year would rank as the fifth most harmful to a portfolio. If we look back and include the prior three years, however, we find the average annual portfolio returns have been about one-half percentage point greater than what we would expect. I have about five months before I need to sell securities for our spending in 2023. Ideally, stocks and bonds recover, and we don’t have to sell at seriously depressed values.