What are the pros and cons of long-term bonds vs. intermediate-term bonds?
Posted on February 26, 2021
Two weeks ago I wrote about potential choices for bonds and displayed a number of options. The purpose of this post is to look at the pros and cons of intermediate-term vs. long-term bonds in more detail. In particular, I wanted to confirm the insurance value of intermediate-term bonds.
Whew! With the last post and this one, I think I’ve exhausted about all I could say about bonds. My conclusion is as before: any of the choices on the sheet I included two weeks ago will work out fine for your financial retirement plan. Intermediate-term bonds offer the same – and maybe slightly better – insurance protection as long-term bonds. Expected returns are about one percentage point lower for intermediate-term bonds than long-term bonds: when we don’t face a Most Horrible sequence of returns, we’ll accumulate less from intermediate-term bonds.
== The pattern of returns ==
I like to look at the pattern of returns. What does a graph tell me? I plot the cumulative real returns of stocks and the two types of bonds from 1926-2020. An obvious difference is the ~one percentage point difference in return between the two: roughly 3.1% expected real return for long-term bonds and 2.2% for intermediate-term bonds.
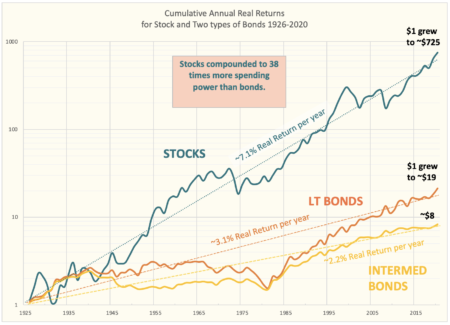
It’s hard to see that one pattern is better than the other in insurance value. The line for intermediate-term bonds looks less variable; I’d expect that: prices of bonds move in the opposite direction of the changes in interest rates. The prices of shorter-term bonds are not as sensitive to changes in interest rates: prices don’t fall as much when interest rates increase; prices don’t rise as much when interest rates decrease.
Both have a very long period of 0% cumulative return. It took took 48 years for the cumulative return for both to clearly surpass their level in 1936! Both decline fairly steadily in the period 1976-1981 when interest rates increased because inflation increased. (Inflation peaked at 13.3% in 1979.) Both show sharp recovery starting in 1981 as inflation and interest rates fell, and both have been fairly stable in return since about 2000.
== Compare performance in the ten worst years ===
This table shows that both long-term bonds and intermediate-term bonds provide similar insurance value in the ten worst years for stocks since 1926. I’m judging insurance value by the spread between stock and bond returns. Both average 27 percentage points BETTER than stock returns for those ten years.
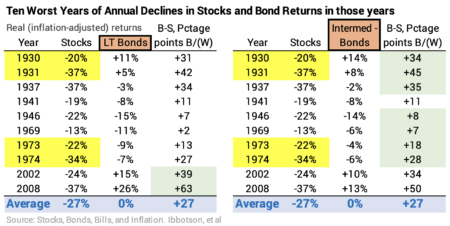
Intermediate term bonds were equal or slightly better than long-term bonds in eight of the ten years, meaning that they gave a bigger percentage point spread. My eyeballs focus on are the two back-to-back devasting years of 1930-31 and 1973-74. Long-term bonds were better insurance value in the most recent worst years, 2000 and particularly in 2008.
From this display, I’d conclude intermediate-bonds clearly are no worse in insurance value than long-term bonds, but I wouldn’t conclude solely from this that they are better.
== The effect on ZERO CHANCE years and SSR% ==
We use a Retirement Withdrawal Calculator (RWC) to lead us to the decisions that lock in the number of years we want for ZERO CHANCE for depletion of our portfolio. For, example, at the start of our plan Patti and I decided on 19 years for ZERO CHANCE for depletion. We found our Safe Spending Rate (SSR%) = 4.40% (See Chapter 2, NEC). That’s the conclusion derived from FIRECalc, the only RWC I trust.
FIRECalc uses a measure for long term bonds – described as “Long Interest Rate” – as its default for the fixed income portion of our portfolio. I want to know: Would I change any of the three design decisions for our plan, particularly our SSR%, if I used intermediate-term bonds?
I choose to use the spreadsheet that I built for this post to compare the effect of long-term and intermediate-term bonds. I want to use my spreadsheet rather than FIRECalc for this since I know the source of data, and I’m not clear on the data sources for FIRECalc: I don’t think “Long Interest Rate” is the same as real annual returns for long-term bonds that I get from my data source that is an industry-standard source.
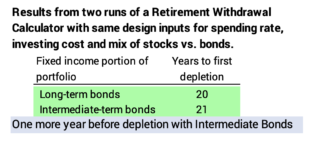
When I input my three planning decisions in December 2014 to the spreadsheet – using long-term bonds – I got 20 years to depletion; that actually was one more year than I get from FIRECalc. Here’s the pdf of that spreadsheet. When I change and use intermediate bonds, I get 21 years to depletion. Not much difference. Here’s the pdf of that spreadsheet.
I conclude that intermediate bonds clearly are not worse than long-term bonds. One could argue that they are slightly better. But I’m not substituting them as the default for the fixed income portion that I originally used in FIRECalc. In other words, I’m not going to increase the age-appropriate Safe Spending Rates (SSR%s) that I show on Graph 2-4 and in Appendix D in NEC. I might judge that the age appropriate SSR percentages that I calculated in NEC are a shade conservative – low – and I’m fine with that.
== Seek about 1% greater return per year? ==
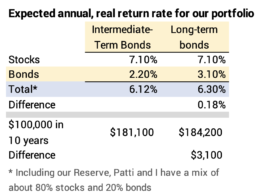
You may be inclined to chase a bit higher potential return than I get from my choice IUSB – iShares Core Total USD Bond Market ETF. You could choose one of the intermediate-term corporate bond or long-term bond funds on the sheet. You might earn one percentage point per year better return over the long haul: 3.1% real return, not 2.2% real return. That would add ~.2% on the expected return on our total portfolio.
I’m not inclined to chase: I’m more comfortable owning a total US bond fund. I like saying, “Patti and I own almost every traded stock and bond in the world. More than 26,000. You can’t get more diversified than that.”
Conclusion: I examined in this post the pros and cons of intermediate vs long-term bonds for our portfolio. Long-term bonds average about one percentage point better in real return per year. Both give very similar insurance value – meaning they both had had far greater returns than stocks in years when stocks cratered. Intermediate bonds might offer a shade better insurance value – a bit longer stretch of ZERO CHANCE years to the first possible chance of depleting a portfolio.
I’m not changing from IUSB that Patti and I hold to a different kind of intermediate bond fund or to a long-term bond fund to chase after that one percentage point. I feel much better knowing that I am highly diversified – IUSB owns a bit of the vast majority of bonds traded in the US. I like saying – in combination with the stock funds we own – “Patti and I own a bit of almost every stock and bond traded in the world. More than 26,000. You can’t get more diversified than that.”
Long term bonds/bond funds were not around in early 1900s, so how can you say how they will react now that we are in a tightening cycle, buy their definition long term bonds have very long duration, and should get killed with rising interest rates, and really no one knows how they are going to react.
They are down over 10% (zfl Canadian long federal bond index) and God only knows what they will look like in a year or two if rates keep rising, they may lose 50% like a equity drawdown.?
Try harder on the next post.