Do the results from Vanguard’s Retirement Nest Egg Calculator make sense?
Posted on March 18, 2022
No, the results one gets from the Vanguard Retirement Nest Egg Calcuator do not make sense. The results lead you to FAR TOO LOW of Safe Spending Rate (SSR%; see Chapter 2, Nest Egg Care (NEC)). I wrote about the shortcomings of the Monte Carlo method to assemble sequences of return here. This post adds: in this post I try to logically build a sequence of returns – more harmful than the actual most harmful in history – that matches the results from the Vanguard calculator. I conclude that I cannot logically do it. I conclude the most harmful sequence of returns that Vanguard assembles is NOT CREDIBLE. Stick with the Safe Spending Rates (SSR%s) that you get from the FIRECalc and that I show in NEC. (See Chapter 2 and Appendix D).
== Sequences of return ==
One has to assemble sequences of stock and bond returns to test in a Retirement Withdrawal Calculator (RWC). I think you have an understanding of the two methods. I described the two methods here.
• FIRECalc uses the sequences of return as they occurred in history. For 20-year sequences, as an example, FIRECalc tests the sequence 1871 trough 1890; the sequence 1872 though 1891, and so forth: 151 of them, in essence.
This post showed that the most harmful sequence in history started in 1969. A portfolio will deplete fastest on that sequence, and therefore the low spending rate that is safe on that sequence – the one that gives you a full withdrawal for spending for the number of years you desire – is your Safe Spending Rate (SSR%). You always use your age-appropriate SSR% to calculate annual withdrawals for spending from your nest egg: you’re following a worst-case plan. All the other 150 sequences of return in history are less harmful. The chances are 150 out of 151 that all of us can increase our safe spending in retirement (See Chapter 9, NEC).
I showed in that same post that the Safe Spending Rate (SSR%) for 20 years is 4.4% using FIRECalc’s data source for returns and its default assumptions stock mix and investing cost.

• Vanguard assembles sequences of return using a statistical method that results in sequences with returns in random order. Inputs to a computer program are statistical measures of returns for stocks and bonds (average returns and a statistical measure of the variations from the average) and not the actual returns. The program can assemble 1,000s to 100,000s of sequences and test each in a fraction of a second.
The program also finds the most harmful sequence – the sequence that depletes a portfolio in the fewest number of years. The Vanguard RWC finds that sequence is much worse than the historical (1969) sequence that one finds with the FIRECalc method.
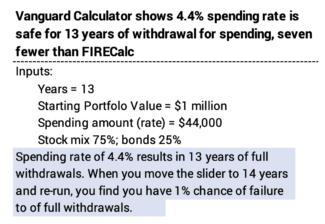
For the same spending rate and mix of stocks and bonds, the Vanguard RWC says that a portfolio will provide full withdrawals for 13 years, not 20: more than one-third fewer years than FIRECalc. Vanguard’s RWC tells you should use 2.9% spending rate to get to 20 years of Zero Chance for depleting a portfolio: more than one-third less spending.
== What does Vanguard’s sequence look like? ==
Vanguard does not display the annual returns for stocks and bonds for its most harmful sequence (or any other sequence). It’s all wrapped up in the big simulation. I want to understand what it looks like to understand how much worse it is than the worst actual sequence in history. I want to judge, “Does Vanguard’s most harmful sequence make sense?”
To answer that question, I assemble sequences that piece together segments of actual harmful sequences. Can I rearrange actual periods of returns to find a sequence that fails in 13 years and not 20 years? Here is my sequence of tests: I use returns since 1928 for this exercise. (I have three data sources that track returns for this period.) I want to stack several-year patterns of returns – I don’t want to stack the worst three year return periods for stocks in descending order, for example.
I settled on two patterns as assembly units: the worst six-year return period for stocks (1969 through 1974) and the worst nine-year return period (2000 though 2008). Can I stack them and match the 13 years of full withdrawals that Vanguard shows? Is the stacked sequence one that we should judge as more realistic worst case?
== The tests ==
I find I CAN stack returns that results in just 13 years of full withdrawals. I have to start with the worst six years in history and then repeat it and repeat it again. The question is, “Is that a credible worst case to assume for your planning?” (Spoiler alert: NO WAY.)
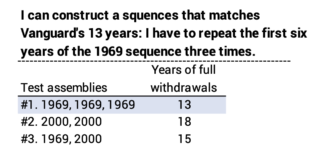
• Test #1. The worst actual 20-year sequence starts in 1969. I build a sequence that starts with its first six years – the worst six-year return period for stocks in history: 1969 though 1974. (The two years 1973-74 are the second worst in history). I then repeat those six years and repeat again. See here.
The stacking of sequences results in a six-year period of -47% real return for stocks; 12-years -72% cumulative return and -85% for 18 years. (The worst 12-year cumulative real return for stocks in history is -25%; there is no 18 years of less than 0% return.)
Does this sequence result in 13 years to depletion and not 20? YES. Stacking the worst six years in history one after the other is harmful enough. This results in 13 years of full withdrawals for spending.
• Test #2. I build a sequence that starts with the worst nine years in history: 2000 through 2008; this sequence starts with the third worst three-year sequence of returns for stocks in history and contains the second worst one-year decline in history. I then repeat those nine years. See here.
Does this result in 13 and not 20? NOPE. This results in 18 years of full withdrawals for spending. (I’m surprised that this can get that close to the actual 1969 sequence.)
• Test #3. I start with the six years of the 1969 sequence and follow that with the nine years of the 2000 sequence. That stacks, starting in the fifth year, the second-worst two-year return for stocks in history followed by the third worst three-year return for stocks in history. This is a five-year -69% decline; the actual worst in history is -38% real return. See here.
Does this result in 13 years and not 20? NOPE. The result is 15 years of full withdrawals.
== Is the Vanguard sequence credible? ==
NO. I conclude that Vanguard’s most harmful sequence of return – the one that provides a full withdrawal for spending for 13 years in our example – IS NOT CREDIBLE. I can match the 13 years, but to do so I have to stack returns such that I get -69% cumulative return for stocks over 12 years as compared to -25% in history. The -69% approaches triple the actual worst in history. I view that is beyond a reasonable assumption of what could be worst case.
Conclusion: The Vanguard Retirement Nest Egg Calculator gives a much more pessimistic result for a safe spending rate than FIRECalc: it cuts years of safe withdrawals by about a third; it cuts the safe spending rate for a given number of years by about a third.
In this post I tried to logically stack patterns of actual returns to see if I should view that Vanguard is constructing a most harmful sequence that should we should use for our worst-case planning. I find I cannot: I matched Vanguard’s result only if I used a sequence of stock returns that cumulated to -69% real return for 12 years. That’s roughly triple the actual worst 12 years in history. I conclude the Vanguard results are NOT CREDIBLE. Stick with the results from FIRECalc and the Safe Spending Rates I provide in Nest Egg Care.