How do Retirement Withdrawal Calculators build their sequences of return?
Posted on May 8, 2020

Two types of Retirement Withdrawal Calculators (RWCs) build sequences of future financial returns we test to make the key decisions for our financial retirement plan. I used to think that the two types were about the same for planning purposes. I no longer trust one type of RWC – the one that uses the Monte Carlo method to build and test sequences of returns. I don’t get to that final conclusion in this post, however. The purpose of this post is to describe the two ways these RWCs build their sequences of return.
(You get good view of RWCs and how they work in Chapter 2 Nest Egg Care (NEC) and in this post.)
The two types of calculators are best represented by FIRECalc and the Vanguard Retirement Nest Egg Calculator. Both use annual returns for stocks and bonds from 1926 to the present (That’s how I use FIRECalc; it could stretch back to 1871.) But they develop the sequences of annual returns they test differently. FIRECalc assembles its sequences of returns in the year-by-year order that they incurred. Vanguard uses the Monte Carlo (MC) method that assembles sequences with annual returns in a random order.
== Why am I concerned about this? ==
I want to discuss this topic because the Vanguard RWC ALWAYS displays a fewer number of years of ZERO CHANCE of depleting a portfolio than FIRECalc. Use them and see for yourself: the table here shows that with the exact same inputs, the Vanguard RWC displays seven fewer years of ZERO CHANCE for depletion. Seven years? Wow.
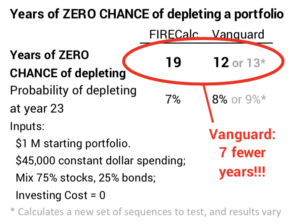
The more I look into this the less I think that is correct: my thinking is that it should be the opposite. FIRECalc should ALWAYS show fewer years of ZERO CHANCE of depletion than the Vanguard RWC. In this post I cite that some of the actual bad period of returns are inconsistent with probabilities based on random ordering of returns. What gives?
I recognized the difference in results of the two when I was writing Nest Egg Care. I discuss the differences in Appendix C. When you look at the probability differences over a number of years (See graph C-2, NEC), the two are close. But that difference in years for ZERO CHANCE for depletion has bugged me for years.
== The MOST HORRIBLE sequence of returns ==
We nest eggers use an RWC and focus on the absolutely MOST HORRIBLE sequence of returns we would ever expect to see. It’s the cornerstone of our financial plan. We get the simplest view of the safety of our financial plan by answering the question, “Given my decisions on spending rate and how I will invest, how many years do I have for ZERO CHANCE of depleting my portfolio?” We pick the number of years we want for ZERO CHANCE of depleting our portfolio, and our RWC leads us to the key decisions on spending rate, mix of stocks and bonds, and investing cost.

== The two ways to build sequences of return ==
Ordering Approach #1. This is how FIRECalc builds its sequences. This is the easiest method to explain and understand. Each segment of returns is constructed from the exact sequence of annual returns as they occurred in the past. Let’s assume we are building 19-year sequences of returns. The first sequence starts in 1926 and runs to the end of 1944. The next sequence starts from 1927 and runs to the end of 1945. And so forth. You’d have 76 19-year sequences.
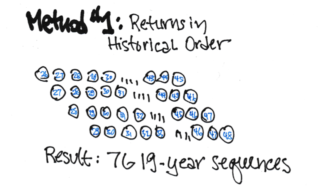
FIRECalc uses a constant dollar withdrawal amount – an amount that adjusts for inflation each year – and real, inflation-adjusted annual return rates to calculate how a portfolio fares over time. That makes the math easy. You see how a portfolio fares in terms of changes in real spending power. I show a spreadsheet that illustrates the calculations to see how a portfolio fares over time here.
Using this method, you find how your portfolio would have fared in spending power for your inputs (e.g., spending rate and mix of stocks vs. bonds) if you retired in 1926, 1927, and so forth. One of those is MOST HORRIBLE that results in the fewest years of ZERO CHANCE of depleting your portfolio.
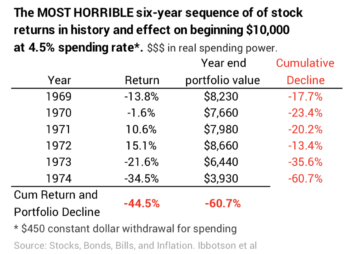
When you look under the hood of FIRECalc, you find the most horrible sequence of returns is the one that started in 1969. I narrowed in to find that sequence just by looking at the graph of real returns over time shown in this post: that time period was the clearly the worst for both stock and bond returns.
That 1969 sequence will lead to the fewest number of years until first depletion for any set of inputs. This is primarily because it has MOST HORRIBLE first six years of stock returns by a long shot, and bond returns (not shown in the table below) don’t save you. This table show what happened to the stock portion of a portfolio over those six years. That 60% decline in real spending power is well below a portfolio’s tipping point. When you assume the same spending amount year after year, it can’t even maintain that low level of spending power and it spirals to zero.
Ordering Approach #2. This is how Vanguard builds its sequences of returns. The Monte Carlo method generates sequences with annual returns in random order. The implicit assumption that each year’s result is totally independent of the others; no events would predict increases or declines in returns. One sequence could be in the order of annual returns for 1927, 1981, 1941, 1967, 1953, 2004, etc. Another one could be in the sequence of 2013, 1974, 1995, 1947, 1986, 1931, etc.
The method follows a fairly complex set of steps to generate its sequences of return that it will test. Let’s again assume we’re building 19-year sequences of return. We need to think if a matrix that is 19 columns with each column 94 high. The method first randomly orders all 94 years of returns and dumps then into column #1 of our matrix. It does the same for column #2, and so on until all 19 columns are filled. The matrix is complete. We have 94 rows, each 19 years long. Those 94 rows are our sequences of returns to test. One of those will be the MOST HORRIBLE sequence.
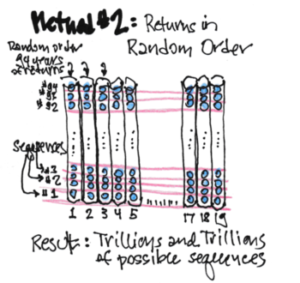
The total number of possible combinations of return sequences from this approach exceeds the number of stars in all the galaxies. A computer is so fast that it’s easy to build far more than 94 rows of sequences to find the one that is the worst. You can think of that as stacking matrices 94X19 on top of each other. It’s so many possible sequences that the RWC has to use a representative sample of all the possible sequences to find the MOST HORRIBLE one (or the small group of the most HORRIBLE ones). A computer is so fast in calculating that these RWC’s use 100s or even 1000s of sequences to find the MOST HORRIBLE one. (Vanguard tests a different 100,000 sequences for each set of inputs!!! That sounds impressive. Is it?)
A Monte Carlo RWC never prints out its MOST HORRIBLE sequence so that you can look at it. You can’t compare Vanguard’s MOST HORRIBLE 19-year sequence to the MOST HORRIBLE one from FIRECalc (1969-1988), for example. You get the result of the number of ZERO CHANCE years – and the probability of depleting in future years – but you’re not sure how it got there.
All the Monte Carlo RWCs that I find – Vanguard’s is a good example – input nominal returns, not real, inflation-adjusted returns. This is where it gets dicey: these calculators don’t think real and get twisted in their underwear when they are tracking what happens to portfolio value over time. This is the source of the BIG DISTORTION in results. I’ll explain this detail in the next post.
Conclusion. A Retirement Withdrawal Calculator (RWC) is an essential tool for our financial retirement plan. The MOST HORRIBLE sequence that our RWC builds is important: it gets us to simplest way to understand the safety of our plan. We use that one sequence to get to our Safe Spending Rate (Chapter 2, NEC).
Two kinds or RWCs build sequences of returns we might face differently: 1) in historical order that returns occurred or 2) in a random order of annual returns. These two methods are best represented by the RWCs from FIRECalc and Vanguard. These two, unfortunately, show a different result for the number of years of ZERO CHANCE of depleting a portfolio for the exact same inputs. This post describes how they build sequences of return to test with our plan inputs. Next week’s post describes how RWCs that use the Monte Carlo method to build sequences mangle their results to get that different result.