Should you trust Retirement Withdrawal Calculators (RWCs) that use the Monte Carlo method?
Posted on May 15, 2020

No, you should not trust Retirement Withdrawal Calculators (RWCs) that use the Monte Carlo method. DON’T EVEN LOOK AT THEM. Two basic types of RWC differ in the way they build and test sequences of returns. For the exact same planning decisions, they give very different results – particularly for a key measure of the number of years of ZERO CHANCE of depleting a portfolio. When I go under the hood to see how they track changes to portfolio value over time, I conclude the numbers the Monte Carlo method calculates give no valuable understanding of how a portfolio may fare in the future. The purpose of this post is to describe how I get to that conclusion. In summary, you want to rely on the method best represented by the FIRECalc RWC.
== Two RWCs and the mystery ==
We use an RWC to show how a portfolio could fare over time for the three key decisions we make for our financial retirement plan: spending rate, mix of stocks vs. bonds, and investing cost – fundamentally the annual fees we pay the financial industry. The two types of RWC, described last week, are best represented as tools available on the internet by FIRECalc and the Vanguard Retirement Nest Egg Calculator.
The mystery presented last week: for the exact same inputs, the two methods – FIRECalc and the Vanguard RWC – differ wildly in the number of years for ZERO CHANCE of depleting a portfolio. This is a key, simple-to-understand yardstick for any plan. In the example last week, the years of ZERO CHANCE of depleting was 19 years for FIRECalc but was 12 years for Vanguard for the exact same inputs. Big difference. That should not be. Something’s amiss with one of them.
== Order of returns in a sequence ==
I’m reviewing what I described last week: Each sequence of returns that FIRECalc tests is a series of annual returns in the historical order they actually occurred. One sequence would be the stock and bond returns for 1969, 1970, 1971, … as an example. The implicit assumption is that the worst of these returns – ones that occurred in periods of recession, depression, and in some cases also high inflation – represent the MOST HORRIBLE set of returns you could expect in the future. In Nest Egg Care I focus on the absolute worst of these: your future results won’t be worse than those you get from FIRECalc; your results will only be better.
Vanguard’s RWC uses the Monte Carlo method to build sequences to test. Each sequence is a series of nominal returns – not inflation-adjusted returns – in random order. A sequence could have returns starting with 1943, 2011, 1952, 1987, 1931, … as an example. The implicit assumption is that annual returns are random, independent events. I mention last week and here and here that that assumption makes little sense to me: the worst actual series of returns are much worse that what the statistics say they could be. But this is not the fundamental problem with the Monte Carlo method.
== Testing the sequence of returns ==
For both calculators, you input a spending rate (This really is an amount per initial portfolio value.) and a mix of stocks and bonds. (You can input your decision on Investing Cost into FIRECalc – that’s essential to understand – but not in the Vanguard RWC; I exclude investing cost in the calculations for this post.)
The calculator uses annual returns based on the mix of stock and bonds you’ve picked. The annual return for a mix of 75% stocks and 25% bonds would be 75% of the stock return in that year and 25% of the bond return for that year. In effect, the model rebalances your portfolio back to your chosen mix right at the start of each year. The RWC calculates and tracks the end-of-year value right before you take your next withdrawal for spending in the upcoming year.
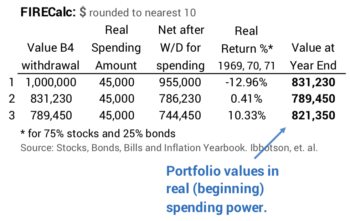
FIRECalc: Annual returns are inflation-adjusted. You maintain the same, real spending amount into the future. (In practice, you’d adjust the spending amount by inflation – similar to the way your Social Security benefit changes – to maintain the same spending power. See Nest Egg Care, Chapter 9.) I show an example of three years: 1969, 1970, and 1971. This is easy math.
Vanguard: Annual returns are nominal returns – returns that include the effect of inflation. Vanguard tracks what happens to an initial portfolio, assuming your initial spending amount increases at ~3% inflation per year – that’s the average annual inflation rate from 1926 to the present; that’s basically an attempt to maintain the same, real spending power over time as with FIRECalc. (An earlier version of Vanguard site had the detailed description of inputs and mechanics; the revised site no longer provides that same detailed description.) I show the example for the same three years below.
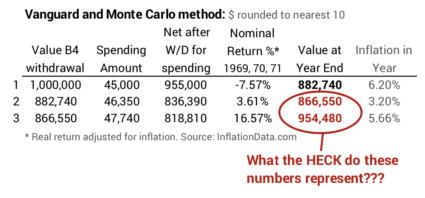
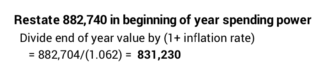
What is Vanguard tracking and plotting at the end of each year? At the end of year #1 it’s calculated what you would have in nominal dollars: $882,740. As a check, we could inflation-adjust that by the 6.2% inflation in the year, and the result would match FIRECalc’s portfolio value stated in real spending power.
But what is the meaning of the end of year values in years #2 and #3? NOTHING that relates to reality! They won’t adjust back to real spending power. The number at the end of all years with the exception of #1 can only be described as, “A number at the end of each year that assumes you adjust spending by 3% each year, even though actual annual inflation can vary wildly from that.” How does that help you in your planning? You have no idea if those numbers mean you are gaining or losing real spending power over time. Vanguard calls these values as “portfolio savings balance.” That’s not an correct label in my opinion.

== Why the distortion? ==
Vanguard’s math distorts what happens to a portfolio in real spending power when it uses nominal returns and a fixed 3% increase in spending each year. In essence, Vanguard is assuming nominal returns are always adjusted by 3% inflation to get its picture of what happens to a portfolio over time. It effectively calculates an amount that is worse than reality for years with inflation less than 3% or better than reality for years with inflation greater than 3%.
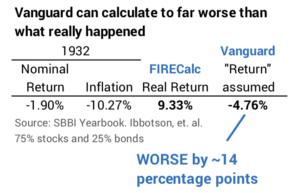
Here’s an example result in a year of deflation: In 1932 the nominal return for a portfolio at 75% stocks and 25% bonds was -1.9%. Inflation was -10.3%. (Yes, 10% deflation!) The real, inflation-adjusted return was 9.3%. With its 3% assumption, Vanguard effectively calculates a return that is worse than the real change in portfolio value by 14 percentage points.
The series of returns in the Monte Carlo method will be mixes of years with below average of inflation and above average inflation. Those series with more years of below-average inflation will have future year-end values will be far worse than they really should be. The opposite is true: series of returns with more years of above-average inflation will have future year-end values that will be far better than they really should be. You see this effect when you look at Vanguard’s projections of future “portfolio savings balances.” The range of future results from high to low is so great that it defies logic.
== Six-years of distortion ==
The distortions each year can add to wild distortions over time. Let’s just nail this down as to how FIRECalc and Vanguard display the results for two identical return sequences of six years. It’s fair to compare the two on these same series of annual returns. The Vanguard calculator will build 1000s of sequences that exactly match these six-year series of returns – and trillions and trillions that don’t.
I pick the returns in order that they occurred starting in 1929 and in 1969. Both are bad, among the four worst six-year periods ever. The six starting in 1929 were in a period of deflation. We’d expect Vanguard to make the results look much worse than they really were. The six in starting in 1969 were a period of above average inflation. We’d expect Vanguard to make the results look much better than they really were.
Does this happen and to what degree? Yes, and it’s a very big difference. I summarize the results in after six years below. You can follow the year-by-year detail here.
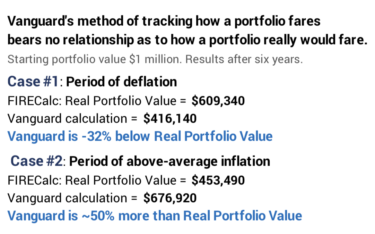
In the first case – the period of deflation – the Vanguard method calculates a number that is 32% less than the total change in real portfolio value. Much worse than reality. In the second case – the period of above average inflation – the Vanguard method calculates a number that is nearly 50% greater. Much better than reality.
Conclusion: We retirees must use a Retirement Withdrawal Calculator (RWC) to make key decisions for our financial retirement plan. Two RWCs differ in the way they build and test sequences of return. They give different results – especially on a key measure of the number of years of ZERO CHANCE for depleting a portfolio. One finds the reason for the difference when one goes under the hood to see how they track how a portfolio fares over time. FIRECalc tracks the real change in a portfolio’s spending power. Vanguard is calculating a number that at best is a tongue-twister to explain. It’s distorts reality; it isn’t giving you a picture of what really can happen to your portfolio over time. My conclusion is DON’T EVEN LOOK at results that use the Monte Carlo method. You can trust FIRECalc’s inputs and method to track how a portfolio really would fare over time.