Is my choice of 85% stock mix risky?
Posted on November 12, 2021

I’ll rebalance back to my design mix in the first week of December. I want to review my choice, since the math has changed slightly as I described in last week’s post. I will now apply my choice of mix of stocks vs. bonds to our total portfolio, not the ~95% portion that I describe as our “Investment Portfolio” in Chapters 1 and 7 in Nest Egg Care [NEC]. I decided on 85% mix of stocks. To some, a mix of 85% sounds risky. The purpose of this post is to explain that I think that my choice of 85% mix of stocks – coupled with my spending rate – is NO RISKIER than any other mix I might consider.
The discussion in this post is similar to the discussion on mix in Chapter 8, NEC, but I use a more detailed spreadsheet rather than results from FIRECalc to show why my choice of 85% mix of stocks clearly makes sense.
== The basic conclusion of this post ==
Any mix of stocks can give you the exact same predictability of a minimum, acceptable future portfolio value. You have to spend a little less now to hit the target with a greater mix of stocks. But you gain an advantage from a greater mix of stocks, because you can expect MUCH GREATER future portfolio value in all but the Most Horrible sequences of stock and bond returns in history. MORE portfolio value is a good thing; it means you can spend or gift more during your lifetime and at death.
== Three critical assumptions ===
You have to buy into three critical assumptions to agree with me that 85% mix of stocks can be just as safe as the conventional mix of 60% stocks that is most often recommended to retirees.
1. Risk is the uncertainty of the end point you want to achieve. The end point we want when we are retired is to have enough portfolio value that allows us to spend to truly ENJOY and know we won’t outlive our money.
Here’s a football analogy. You want your favorite football team to hit a minimally acceptable scoring margin at the end of the game. You don’t care about quarter-by-quarter scoring, the number of first downs, or other game statistics. We just want to know that a minimally acceptable end result is – as close as possible – totally predictable.
2. You use worst case planning to eliminate the uncertainty of market returns. You assume the worst sequence of returns imaginable. If your team hits your target of minimum scoring margin playing in the THE WORST playing conditions ever, you know it will only be better in all other playing conditions.
3. You use the actual Most Horrible sequence of stock and bond returns in history as the worst sequence of returns we could ever imagine. It’s really bad. We don’t have to imagine or construct a worse sequence. It’s the coldest white-out blizzard in history. And your team wins by the desired scoring margin.
Example: Patti and I decided that we wanted 19 years of Zero Chance of depleting our portfolio at the start of our plan in December 2014; see Chapter 2, NEC.) The endpoint was enough portfolio value at the end of the 18th year to allow a full withdrawal for the 19th year in 2033. That’s our minimally acceptable scoring margin.
We used the Most Horrible sequence of returns ever. That’s our white-out blizzard. We use a Retirement Withdrawal Calculator, and we found we would hit our target at a constant-dollar withdrawal or spending rate of $44,000 per $1 million initial portfolio value – we lable that as a 4.40% spending rate. (See Chapter 2, NEC.) Yes, that’s not exactly the same as truly knowing that we won’t outlive our money, since we both could be alive or one of us could be alive after 2033, but we also know the actions we can take during retirement to extend the Zero Chance Years beyond 2033. (See Chapter 4, NEC.)
== You lock in with three decisions, not one ==
Most financial planners talk about risk in terms of one decision: your mix of stocks vs. bonds. But you eliminate risk – the uncertainty of not having an acceptable portfolio value in a future year – by three decisions: your spending rate (a constant dollar amount relative to your starting portfolio value), your investing cost (the overall expense ratio of the securities you own); and your mix of stocks and bonds.
You can hit the exact same minimally acceptable target of portfolio value in future year by a mix of those three decisions. In this post I fix investing cost at 0.10% (You are invested almost solely in index funds.) I can then find the tradeoff between spending rate and mix that hit the exact same target for portfolio value.
A slightly lower spending rate and a greater mix of stocks hit the EXACT same endpoint of portfolio value in a future year. Given that you’ll have greater portfolio value with greater mix in all other potential sequences of return, you want to favor slightly lower current spending and greater mix of stocks.
== The numbers ==
I use the same spreadsheet and Most Horrible sequence of returns in history to track portfolio value over time that I used in recent posts starting with this one. You sell bonds solely for your spending in years when stocks have cratered, and you don’t adjust back to your original mix of stocks vs. bonds. I set the base case at 75% stocks for this post; that’s the minimum mix of stocks that I think you should consider.
I use the example of 20 years of full withdrawals for spending. That means I want enough at the end of the 19th year for the withdrawal for the 20th year. I set the target for portfolio value at the end of the 19th year as $60 relative $1,000 initial portfolio value. That $60 will ensure a full withdrawal for the 20th year, but there won’t be enough for a withdrawal for the 21st year.
I show two spreadsheets here that hit the $60 at the end of the 19th year: 1) for the base case of 75% and 2) for 85% mix of stocks. A 3% lower spending rate at 85% stocks hits the target.
I ran spreadsheets for a wide range of mixes to find the the spending rate for each that precisely matched the end target. The first table is the summary of stock mixes and spending rates the precisely hit the desired target. The second table shows the tradeoff of lower spending amount vs. future portfolio value at expected returns for stocks and bonds. See both of these tables on this pdf.
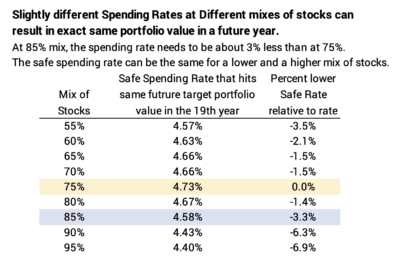

What do these tables tell us for this example for 20 years?
1) In no case does a mix of less than 75% make sense. At lower than 75% mix of stocks, you have to lower your spending rate and your expected portfolio value will be less. That’s a losing combination: worse now and worse in the future.
2) At mixes greater than 75%, you have to spend less now but your expected gain – averaged over all future years – is about five times more than your lower spending. I like those odds.
== 15 years ==
I run the same exercise for 15 years of full withdrawals for spending. I get a similar answer. I can hit the exact same desired minimum portfolio value at 85% mix of stock by spending a little less than if my mix was 75%, for example. And I have the potential about 3 times more in portfolio value than I give up in current spending. That’s less gain potential than for 20 years solely due to fewer years of compounding of returns.
== It’s a value judgment ==
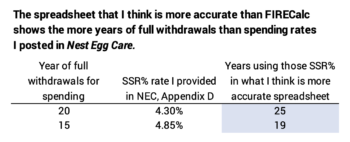
The Safe Spending Rates (SSR%s) that I provide in Appendix D, NEC are lower than those I obtain from my spreadsheet, as I describe in this post. For example, I post 4.30% SSR% for 20 years, and the spreadsheet shows that is 25 years of full withdrawals. See here for more detail. That means if you stick to the SSR%s posted in NEC, you are more than safe for the number of years you pick and you therefore are free to pick any mix of stocks vs. bonds.
I chose 85% because it feels right to me to hold three years of bonds as insurance. I can solely spend bonds for three years when stocks crater. I’m just uncomfortable with holding fewer than three. It is rare event to have three years when stocks crater in a retirement period, but as we see in the sequence starting in 1969, those Horrible years can come in bunches.
Conclusion: Your financial risk is the uncertainty is outliving your money. You can lock in a minimum-acceptable portfolio value in a future year that guarantees you’ll have enough for a full withdrawal for spending. You lock in with your decisions on spending rate, investing cost, and mix of stocks vs. bonds. This post shows that you can slightly lower spending rate and increase your mix of stocks and hit the exact same, safe future portfolio value in the face of the worst sequence of returns for stocks and bonds in history. Safety is locked in with a number of choices. You should always favor a greater mix of stocks, since you gain the potential for far greater portfolio value at all but the Most Horrible return sequence imaginable.