Do you have too low mix of stocks for your retirement portfolio?
Posted on November 5, 2021

This is a good time of the year to reassess your choice of mix of stocks vs. bonds. The purpose of this post is to convince you: you should not have less than 75% mix of stocks for your total retirement portfolio. The safety of your financial retirement plan can decline if your portfolio is less than 75% stocks. That conclusion counters conventional wisdom, which argues that a portfolio with more bonds is always safer – more conservative – than one with less bonds. This post explains why less than 75% stocks – more than 25% bonds – is the wrong decision. (I address your planning decision on mix of stocks vs. bonds in Chapter 8, Nest Egg Care [NEC] and in this post.)
== Good time to reassess ==
This is a good time for me to reassess my mix of stocks and bonds. I rebalance my portfolio the first week in December, but the real reason is that I should use a different math to calculate my mix of stocks vs. bonds.
I altered the logic of how to use bonds for withdrawals for spending in this post four weeks ago. The right way to use bonds is to think of them as insurance. You use your insurance – sell only bonds for your spending – in years when stocks have bombed. I recommend that you want to have enough insurance – a big enough amount of bonds – to absorb at least three explosions that could tear your portfolio apart. Those big hits seem to occur every 20 or 30 years.
The post showed I should pick a mix of bonds based on my total portfolio. In Chapter 7, NEC I thought about using bonds differently. My choice of mix only applied to part (most) of our total portfolio. My choice of 85% mix for my “Investment Portfolio” is much closer to 80% of the total.

== Risk: the relative uncertainty of an end result ==
I hope we are on the same page as to how to think about risk to measure the impact of greater or lesser mix of stocks vs. bonds. I’ve covered this thinking before. I argue risk is the predictability of an endpoint result, not how you get there: let’s look at who wins most often and by how much; let’s not worry about the score inning-by-inning. All of us just a few basic choices of how to get to the best end point: invest in stocks, in bonds, or some mix of stocks and bonds. Which choice gives us the best end result?
The endpoint for someone in the Save and Invest phase of life is different (How to do I invest for MORE?) than for us retirees in the Spend and Invest phase off life (How much can we spend and not outlive our portfolio?)
== My base case ==
I use a base case in this post. I picked the target of a guaranteed 20 years of full withdrawals for spending. I use an investing cost of 0.10%. I use 75% mix of stocks. I test those three decisions against the Most Horrible sequence of stock and bond returns in history to find the spending rate that equates to 20 years of full withdrawals. I use the spreadsheet math that I introduced in this post; it uses the tactic of solely selling bonds when stock returns are -10% or worse.
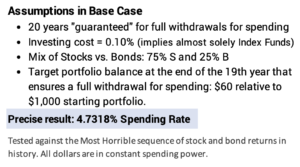
I iterate to hit a fixed amount at the end of the 19th year that is a bit more than what I think the final withdrawal rate will be – I picked $60 relative to an $1,000 initial portfolio. I iterate and find the precise spending rate that hits that target amount. That is $47.318 per year relative to a starting portfolio value of $1,000: 4.7318% Safe Spending Rate (SSR%). This is the spreadsheet for 75% mix of stocks (top half); I also show the spreadsheet for 70% mix of stocks (bottom half) .
== Less than 75% stocks is less safe ==
The question is, “What happens when I lower the mix of stocks? Does that target $60 at the end of the 19th year increase or decrease?”
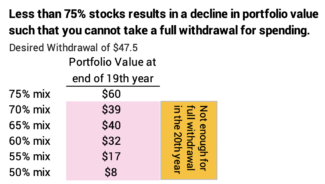
The result is WORSE when I lower the mix of stocks. Each time I decrease the mix of stocks – increase the mix of bonds – portfolio value at the end of the 19th year declines. At 70% mix, portfolio value declines at the end of the 19th year to less than the desired withdrawal of $45.7. That small change in mix calculates to a decline that equates to the loss of one year of a full withdrawal for spending. That’s NOT GOOD.
As I lower the mix of stocks, the portfolio value continues to decline. The declines are small, and you do not lose another full year for a full withdrawal. The conclusion is that a mix of stocks that is less than 75% – a mix of bonds greater than 25% – harms the safety of your financial retirement plan to the point where you can lose a full year of withdrawal for spending.
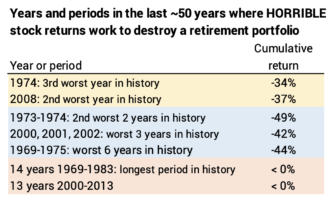
Why is this? Why isn’t the opposite true? The reason is that returns for bonds returns in this period were worse than the really horrible sequence of stock returns. Both had long periods of cumulative returns: -10% for the first 14 years for stocks and -33% for the first 14 years for bonds. -33%! I always want to assume THE WORST future to drive my spending rate and choice of mix of stocks vs. bonds. The worst case shows we can’t count on bonds to save the day when stocks crater, and a mix with more bonds is not the answer to improve future portfolio value.
== Same basic result for 15 years ==
I ran this same exercise to see the effect of mix on the value at the end of the 14th year to ensure a full withdrawal for the 15th spending year. That’s a tougher test than for 20 years since that’s just two years after hitting all five years when stocks bombed -12.7% or worse.
The result is a bit different in that portfolio value improves slightly with a lower mix of stocks, but the changes are not meaningful. Lower than 75% mix never results in one more year of safety – never adds enough in 14 years to get you to a full withdrawal for the 16th year.
== And ten years ==
I ran this for ten years. That’s an even tougher test with four stock explosions in the first nine years. I come to the same conclusion: lower than 75% mix for stocks never results in one more full withdrawal for spending. More bonds are not buying you a meaningful measure of safety.
== You won’t have MORE with mix less than 75% ==
After you’ve made your plan decisions and locked in on safety – e.g., 20 years “guaranteed” of full withdrawals for spending – we retirees want to see how our choice of mix affects future value when stock and bond returns are more normal. In all cases, a lower mix of stocks results in lower future portfolio value. Over a 20-year period, the difference is staggering as I describe in Chapter 8, NEC.
Conclusion: I built a spreadsheet that tracks what happens to portfolio value for a given set of inputs: spending rate, mix of stocks vs. bonds, and investing cost. My sheet uses the Most Horrible sequence of returns for stocks and bonds in history. That single sequence is the severest stress-test to judge the safety of your decisions for your financial retirement plan.
YOU SHOULD NOT HAVE LESS THAN 75% MIX OF STOCKS. (I examined 10 years, 15 years, and 20 years.) In my example for 20 years, less than 75% mix of stocks – more than 25% bonds results in enough of a decline in future portfolio value that you lose one full year of withdrawal for spending. That’s a BAD thing.
The results are a bit different for shorter retirement periods, which are impacted more by the bunching of Horrible Years of stock returns. A lower mix of stocks added portfolio value, but never enough to add one year withdrawal for spending.