How do you invest with the appropriate level of risk?
Posted on March 5, 2021

All investors should be able to answer the question, “Have I invested with the appropriate level of risk?” This raises a basic question, “What is financial risk?” It turns out that I don’t think that’s easy to answer. In my mind the financial industry uses a bizarre measure of risk, one that makes little sense to me. I think I’m super conservative: I have NO thought that I am assuming risk from my choice of stocks and bonds. Yet, financial folks would label Patti and me at our ages as irrationally aggressive. The purpose of this post is to describe how I think about how to invest for the least chance of loss and highest chance for gain. I conclude my view is likely a 35% better financial future for many investors.
== Minimize downdrafts in your portfolio? ==
The conventional thinking is that financial risk is measured by the degree of annual variations in return or portfolio value. Stocks are more variable in one-year return than bonds and therefore are riskier.
Investors focus on declines – they think a decline in the value of their portfolio is a loss even though they won’t sell anything from it for perhaps decades. The goal therefore is to assemble a portfolio – its mix of stocks and bonds – that meets a criterion that the investor likely has in their head as to what is an acceptable, decline in portfolio value.
Example: I feel I will explode with fear and lose sleep if my portfolio ever declines more than 25% from its peak value over a year. Examining historical returns, I can now construct a mix of stocks and bonds that meets that criterion.
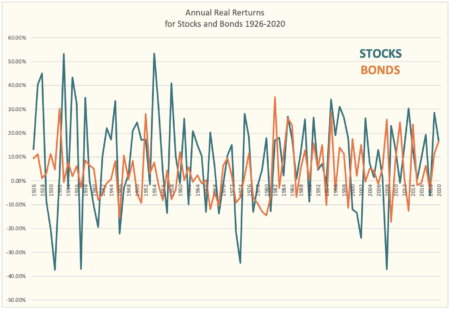
Anyone who looks at this graph of the real annual return for stocks and bonds from 1926-2020 as the basis for their thinking about future stock and bonds returns has to find this appealing. Whoa. Those ups and downs look random, dramatic, and frightening. The emotional part of our brain shouts, “Look at all those times the green and orange lines are below 0! Look at those negative spikes for stocks at more than -30%. I’ll lose sleep if I hit one of those. Can I minimize the downturns? I need help!” (Financial folks love those last three words.)
Modern portfolio theory (MPT) adds sophistication to the process. Its author won the Nobel prize in 1952. It’s the underpinning of how financial folks construct portfolios for investors. MPT provides the math of how to pick a specific mix of stocks and bonds for a portfolio. MPT calculates the mix of stocks and bonds that is the optimum balance of best return and lowest variability in returns. (That link shows the math. It’s beyond description to me.) Once one has the optimum mix, one uses historical returns to find the acceptable, historical maximum portfolio decline.
The optimum mix differs for each holding period. A holding period is how long you hold an investment before you sell it for your spending. I display several optimum mixes for stocks and bonds from a graph that displays MPT calculations of risk-return for a number of holding periods from Figure 6.4 in Stocks for the Long Run, Fifth Edition, by Jeremy Siegel.

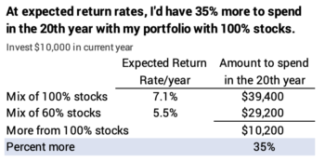
I’ll focus on the result for a 20-year holding period in this post: MPT finds that the best mix is 58% stocks and 42% bonds. A person who invested $10,000 would have a real expected portfolio return of 5.5% per year. $10,000 would accumulate to $29,200 in the same spending power in 20 years. That would be a relatively steady year-by-year ride.

== Model portfolios ==
The financial industry recommends investment portfolios that are grouped by wider time horizons – a number of holding periods. The industry then assigns labels to each general time horizon: aggressive, moderate, or conservative. I don’t track the logic for these labels unless they are meant to reflect greater tolerance for annual variability – primarily the maximum decline from a peak value for a portfolio.
I get the monthly Journal from the American Association of Individual Investors (See aaii.com). The January issue discusses recent changes to three recommended portfolios to lower the recommended portion of stocks in two of the portfolios. Here’s the detail on the three. I’d guess most investors would focus on maximum percentage decline for a portfolio to judge if they are an aggressive, moderate or conservative investor.
I summarize the moderate portfolio for an investor generally between ages 35-55: 60% stock and 40% fixed income. That’s generally someone with a life expectancy between 30 and 50 years; they’ll hold on to some portion of their investments now for perhaps more than 30 years. And then their heirs may hold some portion for decades more.
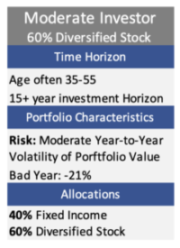
OUCH. That mix is VERY DIFFERENT – far lower in mix of stocks – from what one would derive from Nest Egg Care (NEC). Patti and I in our 70s; we clearly have a shorter time horizon than someone decades younger. I think I’m super-conservative, meaning I know we will NEVER run out of money; we are also best positioned for More over time. Our portfolio mix is about 80% stocks when I include the effect of a Reserve. (See Chapters 7 and 8, NEC.) What gives?
== Investing with the probabilities in your favor? ==
This approach is to construct a portfolio with the most obvious probabilities of the winning combination of stocks and bonds for a holding period. For some holding periods, the tradeoff of potential gain vs. loss is obvious. In others, the tradeoff is more difficult.
To try to figure this out you look at a graph that shows cumulative returns over time. Last week’s post shows a graph that includes intermediate bonds.) This graph hopefully engages the thinking part of your brain. It has the same ups and downs of the previous graph. They don’t look as frightening, and you can clearly see that stocks will outperform bonds by a wide margin over time.
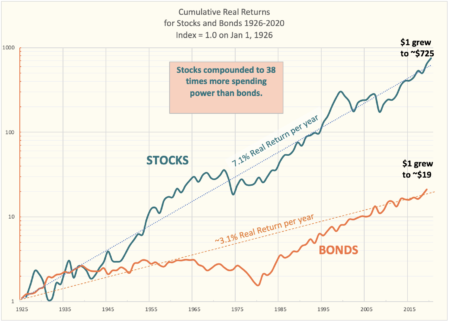
The data is plotted on a semi-log scale. Each unit of distance on Y-axis is the same percentage change. The distance from 1 to 2 (a doubling or 100% increase) is the same distance as from 10 to 20 or 100 to 200. That also works for a decline: a 50% decline is the same distance on the graph: 2 to 1 is a 50% decline and that’s the same distance as for 200 to 100 or 80 to 40 as examples.
== The task ==
The task is to see how both stocks and bonds perform over different holding periods. Let’s assume I’m investing this year for money that I – at least in concept – will spend in the 20th year from now. I want to know which one – stocks or bonds – declines less and which one grows more from the beginning to the end of a holding period. I don’t care about the wobbles or maximum percentage decline of my portfolio at any time in those 20 years: I want to know the mix of stocks and bonds that gives me the best chance for more in that 20th year and least chance for loss.
I display a red horizonal bar at the bottom of the graph you can print from here. It’s 20-years long. I cut a 3X5 card to that length and slide it along points of the two curves to help answer key questions.
== What will outperform over the next 20 years? ==
I want to know: what’s the worst return for stocks and for bonds over 20-year segments? How many times do bonds outperform stocks and by how much? If returns are average over 20-years, how much do I have from stocks and how much from bonds?
Here’s what I conclude when I look at the two curves and use my 20-year measuring stick.
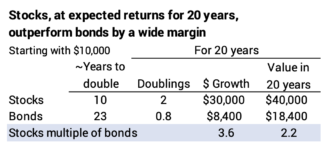
• I don’t need my measuring stick for this: stocks beat bonds by many multiples of return over the long run. The long-run or expected return rate for stocks is 7.1% and it’s 3.1% for bonds. (Intermediate bonds would be 2.2%.) .
Following the Rule of 72, stocks double every ~ten years and bonds double every ~23 years. In 20 years, stocks will have two doublings in the same spending power. Stocks will grow by 400% – from $10,000 to $20,000 and then $20,000 to $40,000. In 20 years, bonds will be about 90% of the way to their first doubling and will grow by 80%. Growth from stocks will be 3.6 times more, and I’d have more than twice as much to spend from stocks than bonds.
• The line for stocks is more wobbly – more variable in short-term returns – than the line for bonds.
• Stocks have several steep one to three-year declines, and bonds don’t decline that steeply over any one to three-year period. The four periods of steep declines for stocks are 1930-31, 1973-1974, 2000-2002, and 2008.
• Bonds have a similar decline from a peak as stocks. Bonds declined from a peak by 50% from 1964 to 1981. The biggest decline from a peak for stocks was 54% from 1929 to 1931.
• Bonds departed below their expected return line far more than stocks. Bonds had to increase by ~300% to get back to their long-run, expected return line, while stocks had to increase by ~80% from their greatest departure.
• Stocks have never declined for a 20-year holding period; they’ve always increased in real spending power. The worst 20-year period was 1969-1989; that was 3.8% real annual return, and that’s .7 percentage points better than the average return for bonds. Bonds declined in real spending power in each of the 14 consecutive 20-year periods from 1952 to 1965.
• The only times that bonds outperformed stocks over a 20-year period were during their Great Recovery, starting in 1982, after their 44 years of cumulative 0% return. The Great Recovery for bonds parallels the Great Squashing of inflation. Bond prices increase as interest rates fall; interest rates fall as inflation falls; inflation in 1979 was more than 13%; inflation has averaged less than 2% per year since 2009.
You have to slide the measuring stick along the two curves connecting points at the end to judge the relative steepness of the upward slope for bonds and for stocks. How many times is the slope steeper for bonds than it is for stocks? The candidate years start in the late 1980s. I can eyeball and find one example where bonds have outperformed stocks over 20 years.
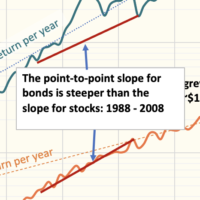
I have to go the actual data to find that there were four cases where bonds outperformed stocks. In two of those periods, returns from bonds were about one percentage point more per year. In the other two, the return difference was small. Stocks outperformed bonds in the other 71 20-year periods, again, by an average of four percentage points per year.

== What does one conclude? ==
What’s the logical conclusion from this? I can’t construct a logical reason to hold ANY bonds for a 20-year holding period. Stocks have never declined in 20 years. The worst return rate for stocks was better than the average return rate for bonds. Bonds rarely beat stocks in return – and only in unusual times and then only by a small amount. In the OVERWHELMING number of cases stocks outperform bonds by a wide margin. Hold ONLY STOCKS for that long of holding period. Accept the annual variability. Accept the declines in your portfolio value along the 20-year ride. The alternative, focusing on how much annual downdraft you might accept, gives up 35% of your future.
== How do I sort this all out? ==
I go through all this same thinking using shorter and shorter holding periods and this is how it shakes out for me. I group the future into the cash for spending in the upcoming year and three holding periods; each holding period has a different mix of stocks and bonds. I don’t have one pile of money. I have three piles.
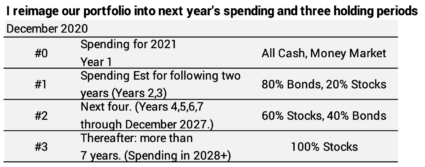
If I were in the Save and Invest phase of life, this is exactly how I would think about how I would construct my portfolio. I might even set up accounts with these groupings of holding periods and mixes of stocks and bonds. I’d forecast future spending needs. I might may very well have a need to sell from my portfolio in three to five years: money needed for the kids’ educational expenses would be a good example. I’d – at least conceptually – put the money I’m saving for that into the account with the appropriate mix of stocks and bonds.
Even in our Spend and Invest phase of life, I find it useful to think about our portfolio this way: I don’t have our accounts arranged by these holding periods, but every December I recast our returns for three holding periods.

Conclusion. When you are in the Save and Invest phase of life, you should think of your future spending as falling into different holding periods – I suggest three – and forecast your spending needs for each holding period. You’ll want a very high portion of bonds for the money you will spend in a year or two, but you’ll want 100% stocks for the longest holding period. I’d have 100% stocks for a holding period of seven and more years.
If you derive your total portfolio mix this way, you are engaging the thinking part of your brain. You are not being ruled by the intuitive, emotional part of your brain that focuses almost solely on avoiding temporary, deep downdrafts in the value of your total portfolio.