Does your brain have the correct financial model for your future?
Posted on April 23, 2021
This week I listened to two talks by Jeff Hawkins, author of a new book, One Thousand Brains. I haven’t read the book yet. The talks are here and here. My summary is that the thinking part of our brain builds models of the world. Correct models lead to intelligent decisions and behavior. If our brains have an incomplete or incorrect model of the world, we might not act intelligently, especially when we are stressed. You need a correct model or map for your financial retirement plan in your brain. In this post I describe the model and supporting story I use to embed it and its rules in my brain.
I’ve described my thinking on the correct way to view financial risk last month, but, as I learned this week, I need to embed my thinking as a model in my brain. An inaccurate model won’t correctly guide my actions, especially in times of stress. The worst incorrect decision – or behavior that is not intelligent – is to sell stocks and go to cash when stocks have declined. Also, an incorrect model leads to holding too small of mix of stocks, and that hurts your future financial well-being.
== Two brains ==
We have two brains. Our, older primitive brain is about 25% of the volume of our brain. It controls all movement, digestion, all emotions, and reflexes. It’s on automatic much of the time without our thinking about it; it controls our breathing without our thinking about it. Wildly abnormal events can trigger fear and reflexive fight or flight reactions.
Our neocortex translates to “new layer” that sits on top of our older brain. If it were flattened out it would be the size of a dinner napkin and about two dinner napkins thick. It’s folded and is about 75% of the volume of our brain. All mammals have a neocortex, and ours is the largest relative to our size.
All sensory input is processed by your neocortex: touch, vision, sound. Sensors from your eyes are connected to the rear of your neocortex. Touch and sound sensors are connected to the top and left side of your neocortex.
== Models in your brain ==
Your neocortex stores memories, builds models of the world, and continually predicts its perception of reality. For example, my neocortex takes the sensory information from 1000s of sensors in my eyes and compares it to models of faces it has remembered. It then predicts, “Tom, that’s Patti.”
Your brain continually anticipates the future, and you plan and act expecting that future to be correct. I have the map of Pittsburgh stored as a model in my brain. I’ve reinforced that model 1000s and 1000s of times over the years by looking a map and by traveling in it. When I have several errands to run, my mind accurately predicts where all the usual places are and predicts what I will see along the route. I can efficiently plan my route. I never make a mistake mixing up the location of the grocery store with the library.
Our neocortex has many 100,000s of models and many different kinds of models of the world. Many are concrete, like my map of Pittsburgh, and many are abstract. Your brain has a model for democracy, for example. Whether you know it or not, your brain has a model of future stock and bond returns and is continually making predictions as to what you should normally expect.
== Incomplete or incorrect models ==
A friend of mine – in the Save and Invest phase of life – told me that she sold all stocks in her retirement plan last October and went to cash. Something in the financial model in her brain predicted that stocks would crash. That set off alarms to her old brain that told her to ACT NOW, and she did. Maybe that was because her model told her something bad would happen if Trump won. Or if Biden won. That’s very different than the model in my brain: I would NEVER stop the potential for compound growth.
Her model or map is not complete enough or is incorrect for her future financial well-being. If I had a very sketchy map of Pittsburgh or pulled out the map of Cleveland to go to the grocery and library, I’d make many wrong decisions and likely never get to where I wanted to go.
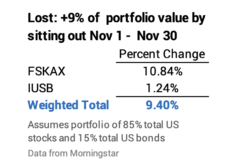
She’s back in the market now, but if she just sat out the month of November, she likely lost – didn’t capture the growth of – about 9% of her portfolio. That’s a big dollar penalty that she can never recapture.
== A correct financial model ==
The graph below is the basic map that I want to store in my brain for our financial future. I want my brain to memorize this map as well as it has memorized the map of Pittsburgh. I want to pour over this map to understand what it is telling me about the world. I want the lessons learned to be part of the model that will direct my future actions. I described this map to my brain last month, but it’s always helpful to reinforce it to my brain again.
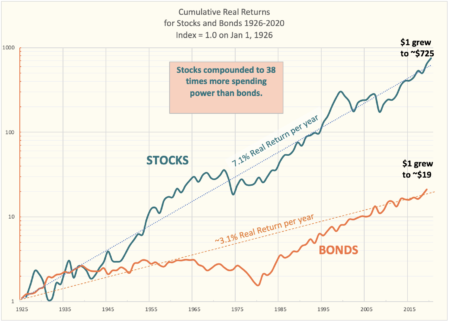
My map is the cumulative real return for stocks and long-term bonds plotted on a semi-log graph. The X-axis is the 95 years from 1926 through 2020. Each measure on the Y-axis equals the same rate of growth. 100% growth is the same unit of measure: 20 to 40 is the same distance as 100 to 200, for example. A constant rate of growth is a straight line on the graph: 1% growth rate is nearly horizonal and 20% growth rate, say, is much steeper than the 7.1% rate shown.
== The story I tell my brain ==
I study and read this graph just as I did with the street map when we first moved to Pittsburgh. I want to store this graph and, more specifically, what I learn from it in my brain, just as I did years ago so my brain knew the best routes to various locations.
I tell my brain to use the concept of holding period to best understand this graph: that’s how long I will hold on to an investment before I sell it for our spending.
Here’s the story I repeat to my brain frequently. I’ll use 25 years as the holding period for this walk-through.
“The difference in slopes of the straight lines mean, on average, stocks have grown six-fold every 25 years while bonds have doubled: money invested in stocks typically grows to three times the amount for bonds. (I roughly apply the Rule of 72 to get that.) The difference in the dollar amount of real spending power between the two grows dramatically with time.
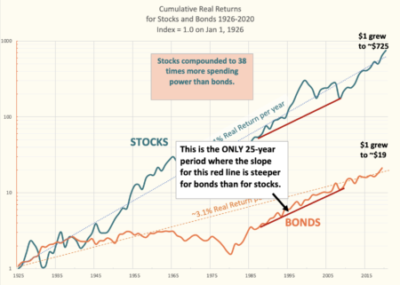
“Stocks have always increased in spending power over every 25-year period. I ALWAYS come out ahead with stocks. Bonds declined in real spending power in ten 25-year periods; they lost more than 40% two times – the 25-year periods ending in 1980 and 1981. Bonds diverged from their long-run average more than stocks, roughly in 1980. Bonds have competed in returns for stocks – sloping upward toward their long-run average – only after that very long period of no return. The line for bonds wiggles less for bonds than for stocks.
“I can compare the steepness of a line between two points 25 years apart on the graph to find the number of times when bonds performed better than stocks. That obviously has to be in the period bonds were rising up to get back to the line for their long-run average. Bonds have outperformed stocks one time by a factor of 1.3 (1983-2008). In all other times, stocks outperformed bonds, and the best return for stocks was 13-times that for bonds (1941-1966). (I had to refer to the actual data for the graph to get all this detail.)
“I conclude my session with my brain: ‘Brain, I want you to embed the rule and behavior that I should hold 100% stocks for long holding periods’.”
== The conclusions for shorter holding periods ==
Since Patti and I are retired and older, a 25-year holding period isn’t a good example for us. I’ve walked through the same steps with shorter and shorter holding periods. I simplified what I learned into rules for the mix of stocks vs. bonds for three groups of holding periods. I want to embed these rules into memory.
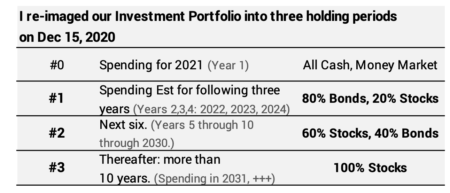
== The story my brain remembers ==
It isn’t easy to memorize the table. I constructed a story as a memory aid. I play this story every December 15 after I’ve sold securities for our spending in the upcoming year. (This is the story from December 2018.) The story is that I am bottling wine that Patti and I will consume in the upcoming year. I’m emptying the nearest wine barrel that held the amount we’ll drink next year, and it’s one of a series of wine barrels. Each barrel has aged in a precise blend and number of years consistent with the table. The wine that we drink in 2021 has aged in a precise way for more than ten years.

It’s a story. I used the more rigorous steps in Nest Egg Care to decide our overall mix of stocks and bonds. But every time when I’m finished with my tasks and look at the bottles and those barrels in order for the following years, I conclude that Patti and I are logical, conservative investors. I think very few retirees have as conservative of mix of stocks each December for a our emergency reserve plus the next four years of spending, for example. I conclude that our overall mix of 85% stocks vs. 15% bonds makes perfect sense.
Conclusion: Our brains build models of the world. The models predict our future. We plan and act based on our understanding of the future. We want to embed the correct model of our financial future in our brain, so that we will act correctly in times of stress. This post describes the map and rules I want for the model in my brain. I tell a story to my brain at least once a year, so that it can most easily remember the model and rules.