What mix of stocks should you have before retirement?
Posted on July 23, 2021

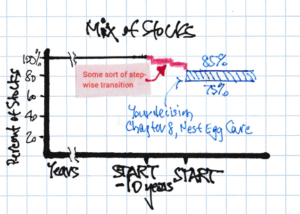
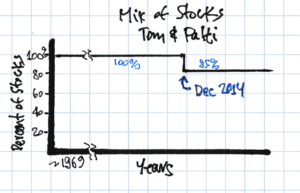
How do you set your mix of stocks and bonds before the start date of your retirement? Patti and I officially started our retirement plan in December 2014. That was the first year we took a full withdrawal from our nest egg for our spending in 2015. I decided on a mix of 85% stocks during retirement. (I recommend you decide on a range between 75% and 85%, and you’ll find my logic in Chapter 8, Nest Egg Care [NEC].) How should we have been invested prior to that date? The purpose of this post is to describe my thinking on your decision on your mix of stocks vs. bonds prior to retirement. My basic conclusion: your retirement nest egg should be invested 100% in stocks for most all years prior to retirement.
== How to Invest ==
Let’s knock off this checklist:
• You’ll invest in financial assets – stocks and bonds. Stocks and bonds have a long record of real growth – returns over time that are greater than inflation. Stocks return about 7% per year and bonds return about 2.6%. (I average the real returns for long-term and intermediate return bonds.) Non-financial assets, real estate and commodities as examples, are components of the calculation of inflation. They keep pace with inflation; they don’t outdistance it; in general, they have no or very low real return over time.
• You’ll invest in index funds. You MUST be a low-cost investor in retirement, and you must be a low-cost investor before retirement. The only way to reliably keep most all the market delivers is to invest in index funds. Patti and I predictably keep +99% of what the market delivers to investors before consideration of costs; the weighted average of our investing costs is 0.05%.
• Your mix of stocks will be greater before retirement than in retirement. I’d work backwards from your decision on mix of stocks and bonds in retirement. In Nest Egg Care I picked 85% for Patti and me. That means I should have owned more than 85% stocks in all the years before our first full withdrawal for spending. If you pick 75% as your mix for your retirement plan, you should own more than 75% stocks.
== Retirement >10 years from now = 100% stocks ==
I argue that you should be 100% stocks in all but the last ten years before the start of your retirement plan. That mix gives you by far the best odds of having more throughout the period of full withdrawals from your nest egg for your spending in retirement.
An example: The official start of our retirement plan was December 2014; that was the first date we took a full withdrawal – our Safe Spending Amount – for spending in an upcoming year. (See Chapter 2, NEC.) Following the recommendation in this post, that would have meant that I should have been 100% stocks up to December 2004. (Patti and I were.) I could then transition to the mix at the start of our retirement plan that I get from my decisions from Nest Egg Care: 85%. (See Chapter 8.)
== The odds of MORE in 10-years ==
How do I judge that you should be 100% in stocks if you are 10 or more years before the start of your retirement plan? I build the historical sequences of 10-year returns for stocks and for bonds and compare the two. Here are questions I would ask:
1) At the average of the sequences of returns, how much more might you expect from stocks relative to bonds? Is this a meaningful difference?
2) Stocks and bonds are variable in return. Your portfolio won’t always grow in real spending power in 10 years. How often do stocks return more than you started with over 10 years? Is that more or less frequent than bonds?
3) Since stocks are more variable in return, we’d expect 10-year periods where bonds outperform stocks. How often did bonds do better than stocks? How much better?
== 75 sequences of 10-year returns ==
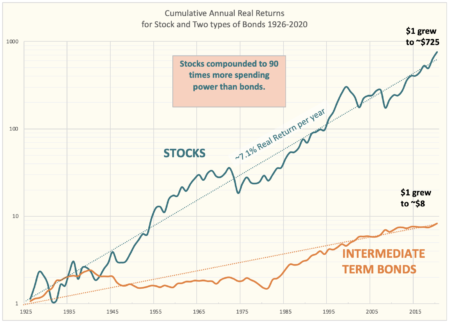
I compiled the cumulative increase in real spending power for 75 10-year return periods ending in the years 1945 – 2020. That means I’m not including the unusual returns for stocks and bonds 1926-1935, basically during the Great Depression. I used Intermediate bonds in the comparison; I think that’s the closest to what we hold when we invest in bonds. I used the year-by-year return data that for this graph of cumulative real returns over time. I show the calculations for the increase in real spending power for all the 10-year sequences in this PDF.
== Here are my findings ==
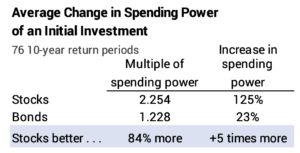
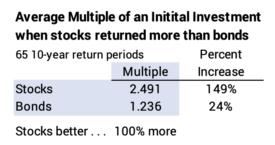
• You can expect (using the average returns from the return sequences) that you will have about 85% more total spending power from stocks than from bonds at the end of 10 years. That’s a lot! I average the results for the 76 return periods and find that stocks more than doubled in real spending power, while bonds increased by about 25%. Stocks great 5.5 times more than bonds.
• Stocks returned more than you started with more often than bonds. Stocks returned more than you started with in 66/76 cases: I translate that to the chance are 7 out of 8 that stocks return more than you start with. Bonds returned more than you started with in 45/76 cases: 6 of 10 chances. (I highlight these years on the PDF.)
I flip those numbers: stocks returned less than you started with in 1 in 8 chances; bonds returned less than you started with in 4 of 10 chances.
It’s better for bonds if one looks at the return periods ending the last 35 years; that’s the most favorable period for bond returns; they started their climb out of decades of 0% cumulative return. In the last 35 years, bonds always returned more than you started with in the prior 10 years; stocks returned less than you started with in three cases. Those three cases hold parts of two the four worst patterns for stock returns since 1926: the very steep declines in 2000, 2001, 2002 = -42%; and 2008 = -37% real return.
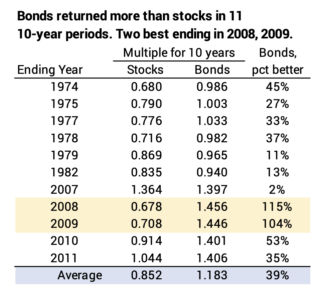
• Bonds returned more than stocks in 15 out of 100 cases: bonds returned more than stocks in 11/76 cases. The detail is on the PDF. Most all of those cases were when stocks returned less than 0% over the ten years. (Those are periods in the 2000s and those in the 1970s; the steepest decline for stocks since 1932 was 1973, 1974 = -49% real return.) The two best 10-year sequences for bonds relative to stocks were the two 10-year periods ending in 2008 and 2009: bonds returned twice as much as stocks.
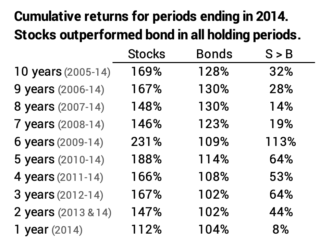
• I flip this: stocks returned more than bonds in 85 of 100 cases: stocks returned more than bonds in 65/76 cases. In those cases, stocks doubled the return from bonds.
• Bonds returns were greater than the average return for stocks in 1 in 30 occasions (2/76).
== What do I conclude ==
I conclude the odds clearly favor stocks. I can’t construct a logic that says you should hold bonds for a 10-year (or longer) holding period. If you are ten years or more years from retirement, you should be 100% invested in stocks. That gives you the best odds to have more at the start of your retirement plan and thereafter. When you reach that 10-year mark, transition in a way that feels comfortable to you from 100% to your design mix at the start of your retirement plan.
== It’s just for a small slice of your portfolio ==
If you think about it a bit differently, you’re not making one 10-year decision on your total portfolio. You could think of your portfolio as divided into many future holding periods. In our example, the shortest holding period is ten years. You’re really making a number of decisions as to how to invest small slices of your portfolio; each slice has a longer holding period.
Let’s assume Patti and I had Nest Egg Care and worked through our retirement plan in 2004, planning our first full withdrawal in late 2014 for our spending in 2015. Let’s assume we found that in 2014 we would sell 4% of our portfolio for our spending. (It was actually 4.4%, but it’s simpler to use 4% in this example.) I could have viewed that I had a 4% slice of our portfolio in 2004 that had a 10-year holding period. I’d assume the next year – late 2015 – we’d sell a second 4% slice; that slice would have an 11-year holding period. And so on. I’d have a total of 25 slices with holding periods ranging from 10 to 35 years – to 2039.
The odds more obviously favor stocks and not bonds as the holding period lengthens. For example, there is no case where bonds outperform stocks if the holding period is 18 years or more. If I thought that way, I’d be much more confident in holding 100% stocks if I was ten years from retirement.
== I didn’t have the end point in mind ==
I had no financial retirement plan until Patti and I were basically retired. I couldn’t logically work back from the end point of the start of our retirement. Fortunately, my historical pattern of investing paid off. I’d been 100% stocks for decades, and I was 100% in stocks in 2004. Without thought, I remained 100% in stocks until the start of our retirement. I just changed in a matter of weeks in late 2014 from 100% stocks to 85% stocks.
My lack of transition or glide path did not hurt. Working backwards, stocks outperformed bonds for every holding period. I always earned more by having stocks and not bonds. My sudden transition from 100% to 85% could have not been better.
Conclusion: Nest Egg Care helps you make the key decisions for your financial retirement plan. One is your mix of stocks and bonds. I recommend you pick between 75% and 85% in Chapter 8. I picked 85% for Patti and me. This post asks, “What mix of stocks should I have before retirement?” It is always more than your mix at the start of retirement. This post examines the odds of having more in 10 years from stocks rather than bonds. I conclude you should be 100% in stocks all years up to 10 before the start of retirement. You can transition from 100% – changing your mix bit by bit; the exact pattern is not critical – to get to your design mix at the time you take your first full withdrawal from your nest egg for spending.