Part 2: Is your retirement portfolio at its peak value for the rest your life?
Posted on July 2, 2021
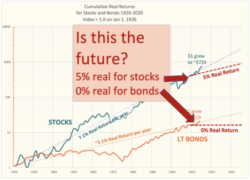
Two weeks ago I read this article “The Long-Term Forecast for US Stock Returns = 7.5%”. When I adjust for the assumption for inflation, the article forecasts a ~5% real annual return for stocks vs. the historical average of ~7%. That’s 30% lower ((5-7)/7). The purpose of this post is to explain how this and other forecasts are telling us to “Throw away what you think is normal based on history. It’s a very different, far less attractive future.” I also want to explain what 5% real return for stocks means for the decisions for our financial retirement plan.
Here’s the answer to the question for those of us who are retired: assuming long-run, real returns for stocks will be about 5% (And the forecasts are 0% real return for bonds.), your portfolio value today is AT OR NEAR ITS PEAK FOR THE REST OF YOUR LIFE. Your retirement portfolio WILL NOT GROW in real spending power over time, because the expected return rate for your total portfolio is LESS THAN the percentage you withdraw each year for your spending. But I conclude, as I explain later, those forecasted, lower return rates do not affect your age-appropriate Safe Spending Rate (SSR%; Chapter 2, Nest Egg Care [NEC]).
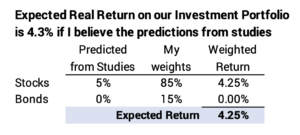
Example: if I use 5% for the future real return rate for stocks and the 0% predicted for bonds, the expected return rate for my investment portfolio is 4.3%. If you have a lower mix of stocks than Patti and I have, your expected return rate would be less.
Last December Patti and I withdrew 4.85% for our spending. (We’re older than most!) That’s zero chance for depletion in 15 years assuming we’re starting now on the Most Horrible return sequence for stocks and bonds in history. We withdrew more than the 4.3% expected real return on our portfolio.
I would therefore expect this year that I we would NOT earn back in real spending power what we withdrew last December for our spending in 2021. When I calculate for our Safe Spending Amount (SSA) this coming December, I’d expect that Patti and I will only be able to adjust our current SSA for inflation (See Chapters 2 and 9, Nest Egg Care.) I’d expect that pattern – no real increases in our SSA – to repeat in future years, and I’d expect our portfolio to decline in real spending power over time. (The return on our portfolio is good so far this year; we’re on track to earn more than we withdrew last December.)
I conclude that if the future is 5% real return for stocks, we all need to be happy with our current SSA, because we won’t see much of a real increase. (Patti and I are happy! Our SSA has increased in real spending power by 32% over the last six years. See here.)
== The studies of future returns for stocks ==
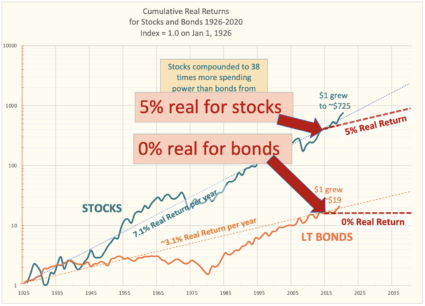
On this sheet that you can download I list a number of studies that forecast future returns. The forecasts haven’t changed much for a number of years. My summary is that 5% real return for the long-run average for stocks is about the average of the predictions. The prediction for bonds is about 0% future real return.
I sketch the predicted rates for stocks and for bonds on a graph. I start the new trend lines in 2015, roughly when all these predictions started. The cumulative return lines for stocks and bonds started on the predicted return lines, but both are above their predicted trend lines now. Over time the new trend lines depart widely from the historical averages.
== Worse over next 5 to 10 years ==
All the studies predict corrections for stocks over the next decade to get back the cumulative return lines back to their trend lines. Most of the studies imply that stocks are over-priced by about 30%, meaning a 3-percentage point deficit in return over a decade to interest the trend line.
One of the forecasts of returns is not credible in my view. That’s -7.8% real annual return for stocks over the next seven years. That’s worse than the Most Horrible seven-year return sequence in history. And the economic forces during that period were particularly bad.

== How do they calculate 5% real return for stocks? ==
The general logic for the predictions is the same; none of them give enough details to know exactly how their model works or clearly describe impact of the factors. Each implies a logic that generally follows my text here. I think my text is clearer than any of the descriptions I read in those reports:
• “You shouldn’t base the future on the simple extrapolation of the 95-year average of 7% real return for stocks. That’s not a logical way to predict the future.
• “We built a model that identifies what drives stock returns. The fundamental drivers of returns have been corporate profitability and growth: these two drive the ultimate cash return to investors: dividends and cash returned in the form of retiring outstanding shares.
• “The future economy and company profitability are very different from the past. A key change, for example, is that economic growth – the real growth in Gross Domestic Product – is forecast to grow at 2.3% per year in the future as compared to 3.1% for the past 70 years. (I have no idea as to their assumptions on corporate profitability and I think that would have a much greater impact on future return than growth.)
• “When we put our forecasts for the key inputs into our model, our model tells us that you should expect 5% real return for stocks in the future, not 7% as in the past.”
== Where’s the beef? ==
How good are the models? How accurate have they been? Should we believe what they say? The general logic for the models makes sense to me, but the models lose credibility when the actual results vary WIDELY from the predictions. These predictions for about 5% real (or lower) returns have been around for more than five years. Real stock returns have been about 2½ times the predicted returns over the past six years.

In 2016, one of these studies forecast 0% probability that a portfolio would earn 5% real return over the decade. The real return rate for the first 4½ years has averaged 11% per year.
NONE of these reports acknowledge that actual results have been far better than their forecasts. I’d like a study to clearly state something like this: “Stock returns over the past five years have been at more than twice our predictions, and we’ve changed our model to reflect that. We now forecast ….” Or, “Stock returns over the past five years have been more than twice our predictions. We are sticking with our model, and the explanation of the return difference is that we believe stocks are now GROSSLY over-valued – by more than 50%! Stocks need to drop by about 35% from the current level to be in line with our predictions. Here’s how you know that stocks are grossly over-valued: …..”
== Implications for my plan ==
Nothing about these studies tell me to change the decisions for my retirement plan. For example, I am not going to lower the amount we withdraw for our spending. I will NOT CHANGE the age-appropriate Safe Spending Rates (SSR%) that I display in NEC. (See Chapter 2 and Appendix D, NEC.) I used 4.85% last December for our spending in 2021; I will use – actually test to see if I can use – 5.05% for this upcoming year.
Your age-appropriate SSR% is based on the assumption that you will face – starting NOW – the Most Horrible sequence of stock and bond returns in history. The cumulative real return for that sequence was 0% for stocks and 0% for bonds for 14 years. I argue that there is nothing in these forecasts that suggest we should assume a return sequence worse than that one.
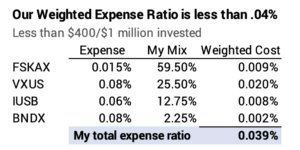
But if I thought the future was 5% stock returns and 0% bond returns are the future, I’d double down on LOW, LOW investing costs. A cost of one percentage point/year is 23% of the growth at 4.3% expected portfolio return (-1/4.3). That’s a Big Bite. I can’t get much lower investing cost than I am now, about .04%.
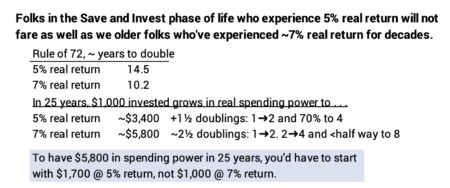
== Those in the Save and Invest phase: UGH ==
We older folks have lived through decades averaging about 7% real return rate for stocks. If it’s a 5% future real return for stocks, younger folks have to save 70% MORE what we had to save to be as well off as we are. The Rule of 72 tells us that stocks double in real spending power in +14 years years at 5% as compared to every ~10 years at 7%. Money invested at 5% grows ~3.5X in 25 years. Money invested at 7% grows ~6X in 25 years.
Conclusion: A number of studies forecast the future real return for stocks is 5% (or less) relative to the historical 7% real return rate. They’ve forecasted this new normal for a number of years. They’ve not been accurate: real stock returns have averaged more than double their forecasts. But the forecasts could be right.
This post explains that if the forecasts are right, you likely are at the peak of portfolio value for the rest of your life. Your withdrawal rate – your age-appropriate Safe Spending Rate (SSR%) you get from Nest Egg Care – will be greater than the expected return rate on your portfolio. You typically will not earn back the amount you are withdrawing each year.
This post explains that a long-run average 5% real return rate is not a disaster: it does NOT mean we should withdraw less for our spending. That lower average future rate does not threaten the number of years we can plan for ZERO CHANCE of depleting our portfolio.