Use this calculation sheet to find your Safe Spending Amount next year.
Posted on December 11, 2020
You must recalculate to see if your annual Safe Spending Amount (SSA) increases (See Chapters 2 and 9, Nest Egg Care.) You need a spreadsheet for this calculation. The purpose of this post is to provide you with a simpler spreadsheet than I have previously provided. You can download it here and I also provide it for download under the Resources tab.

== Detail, detail, detail ==
Last week I updated my calculation sheet for our Safe Spending Amount for 2021. That sheet shows A LOT of detail. I want to track the year-by-year history from our beginning in December 2014. It’s an extremely busy sheet when I annotate it! I can see and you can see what happens to our original Investment Portfolio (Chapters 1 and 4, NEC) and our annual SSA. You don’t need that level of detail for your calculations.
== Recalculate ==
You must recalculate your SSA because IT CAN ONLY GET BETTER. It can only increase. It gets better because with more years you have a better chance that market returns will add up such that you have earned back more than you’ve withdrawn for your spending. Also, your increasing Safe Spending Rate (SSR%, Chapter 2, NEC) aids in the calculation; your SSR% increases as the years pass because you logically are planning on a shorter retirement period. (“Retirement period” is the euphemism for life span.) You don’t quite have to earn back all that you withdraw to calculate to a bigger SSA.
I recalculate every year. Because of one-year variations in return, I’ll find years when I can’t calculate to a greater SSA the next year. That’s happened in two of the last six years. In those years – December 2015 and 2018 – the detail that I show on my sheet says that I had too little portfolio value to support my current SSA. I show those shortfalls in the detail on my calculation sheet.
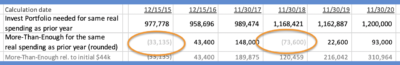
When I can’t calculate to a greater SSA – and see that I have too little to support my current SSA – I just keep the same real SSA. I don’t lower it. I trust the logic that has calculated the SSR% based on the Most Horrible sequence of returns that stretches for more years. I simply wait for next year’s recalculation and hope that stock and bond returns trend back to their expected levels.
If you calculate yearly, you will have years that don’t recalculate to a greater SSA. That means you have a current shortfall in your portfolio value, and you could calculate to see how big that shortfall is. If shortfalls make you uncomfortable, I’d suggest you recalculate every three years. I’d bet you’d NEVER see a shortfall and ALWAYS calculate to a greater SSA. (All bets are off on that statement if it turns out that we all find that we are riding along a Most Horrible sequence of returns.)
== A real increase in SSA starts a new series of calculations ==
Every time you calculate to a greater, real SSA, you can basically throw away your current spreadsheet and start anew.
This is analogous to throwing away your original (or current) FIRECalc graph of results and replacing it with a new one. Example:
• I started our plan with the graph for 19 years of ZERO chance of depleting our portfolio: that was SSR% of 4.40%. (See graph 2-4, NEC.)
• It took two years, but the calculation then told me that I should throw that graph away, in essence, and replace it with the FIRECalc graph for 17 years of ZERO chance of depleting our portfolio. (Patti’s life expectancy [rounded] was two years less.). The SSR% associated with 15 years is 4.60%, and that’s the percentage I withdrew in December 2016.
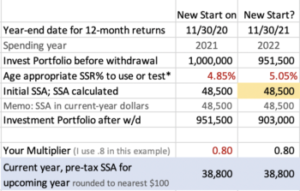
All of us who use the 12-month returns ending November 30 are starting anew. We all calculated to a greater SSA. We also can use the much simpler spreadsheet. The calculation of SSA for 2022 is also simpler because I added an excel formula that tells me directly if I calculate to a greater real SSA or keep it the same.
The sheet shows my new start. You have to change a few numbers to make it your sheet. Next December 1 I’ll spend ten minutes to enter the 12-month return data and find our SSA for spending in 2022.
Conclusion: You must recalculate to see if you can increase your annual Safe Spending Amount (SSA). I recalculate each year based on the 12-month results ending each November 30. I assume that’s the same for you. In this post I provide a simpler calculation spreadsheet than I previously provided. I set this sheet up for my calculation the first week of December 2021. You have three numbers to change to set it up for your calculation. You have a few more data points to enter after November 30. You will quickly and clearly find your SSA for 2020.