How big is your retirement pay increase for 2021?
Posted on December 4, 2020
If you use November 30 to calculate your upcoming annual Safe Spending Amount [SSA, See Chapter 2, Nest Egg Care (NEC)] you HAD TO calculate to a real increase for your 2021 spending. You earned back more this year than you withdrew last year at this time, and that always leads to a real increase in your SSA (See Chapter 9, NEC). The purpose of this post is to show the detail and describe the highlights of my calculation for ~8% real increase in our SSA for our 2021 spending. You had to be close to this increase. And you have more in your Investment Portfolio that you’ve ever had in your life.
== Increases in four of the last six years ==
I base our SSA for the upcoming year on 12-month returns on our portfolio ending November 30. Wow! What an unexpected result! We calculate to ANOTHER real pay increase – ~8% more in real spending power for 2021 vs. 2020. That’s a real increase in four of the last six years. You have seen similar real increases in your SSA if you follow the recommendations in Nest Egg Care (See Chapters 2 and 11). Increases for Patti and me over the last six years add to +32%.

== Real 13% growth in our portfolio ==
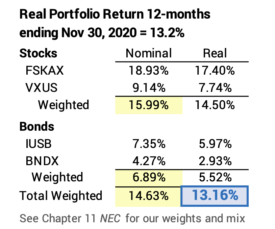
Our portfolio return was 14.6% for the past 12-months. When I adjust for 1.3% inflation, that’s +13.2% real return. We withdrew 4.85% last year for our 2020 spending, and we obviously earned back more than that. When you earn back more in real spending power than you withdraw, you ALWAYS calculate to a real increase in your SSA. (See Chapter 9, NEC.)
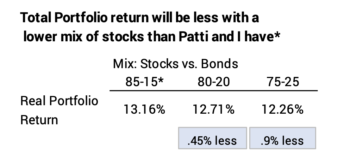
You may have calculated to more than our ~8% real pay increase. If you are younger, you withdrew less than 4.85% last year; that would lead to a greater increase in your SSA at our mix of stocks and bonds. But you may not use the same mix of stocks vs. bonds that I use, so your portfolio return may have been less. My guess is that you are very close to +8%.
== Should I really use +13% real return for the year? ==
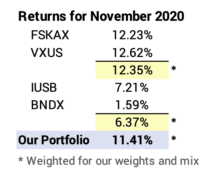
My 12-month return was BOOSTED by a fantastic November. My portfolio return for November was up +11.4%. US and International Total Stocks increased by +12%. Should I consider the total for the year as real for my calculations? Or, should I discount the total because November was an anomaly? Answer: I won’t discount our 12-month returns; Ijust play the cards I’m dealt. I’m sure I’ll have really poor Novembers in the future, and I won’t adjust upward just because they were bad.
== Steps to calculate our SSA this year ==
Note: I modified the Safe Spending Rate (SSR%) (See Chapter 2, NEC) that I use to see if I would calculate to a higher, real SSA for this upcoming year. I kept the SSR% the same as last year: 4.85%. I kept it the same because my assumption of Patti’s life expectancy is still 15 years even though she is obviously one year older. (Patti’s life expectancy drives my choice of SSR% for our SSA calculation [See Chapter 4, NEC.])
I previously found Patti’s life expectancy was 14 years at her age now. I got that from the Vanguard Probability of Living Calculator that I used six years ago. (Vanguard unfortunately no longer makes this calculator available.) I used the Social Security Life Expectancy Calculator as a check, and it shows her life expectancy from November 30 is 15 years (rounded). I therefore repeat the 4.85% SSR% applicable to 15 years.
(The SSR% links to years. Patti and I use her 15 years of life expectancy. Fifteen years = 4.85% SSR%, and that means ZERO CHANCE of depleting our portfolio for 15 years and ~2% probability of depleting in the years thereafter. Those are the probabilities if I fail to adjust spending throughout our retirement; just a bit lower spending extends the number of ZERO years and pushes the 2% years further away. See Chapter 4, NEC and Appendix D.)
== Three entries ==
I have to enter three numbers on our calculation sheet to find our SSA for 2021. Those are the cells highlighted in yellow. I then copy the cells to calculate, and I get to our SSA.
• I use the Social Security COLA for inflation.
• I enter nominal returns for stocks (15.99%) and for bonds (6.89%) for the last 12 months. I get those 12-month returns for each of our securities on December 1 from Morningstar.
== Highlights ==
I annnotated my detailed calculation sheet so you can follow the highlights more clearly. Here’s the calculation sheet without annotations. I state these results in terms of real spending power:
• 2020 total portfolio return = +13.2% in real spending power.
• Since the start of our plan six years ago, the real return on our portfolio has averaged +10% per year. That’s above the 6.5% expected return rate on our portfolio. (The expected real return is 7.1% per year for stocks and it’s 3.1% for bonds.)
• Our portfolio on November 30, before our upcoming withdrawal for 2021, is 7.5% more than it was last November 30 right before we withdrew for our 2020 spending.
• Our age-appropriate Safe Spending Rate (SSR%) repeats as 4.85% for this upcoming year. Therefore, our Safe Spending Amount (SSA) for 2021 is 7.5% more than it was for 2020.
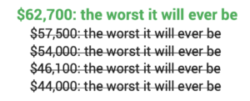
• Our SSA for the upcoming spending year 2021 is 32% more than for our first spending year 2015.
• Our portfolio on November 30 is 19% greater in real spending power than it was before our first withdrawal in December 2014. That’s after six withdrawals for spending equal to 29% of the total that we started with.
• We’ve calculated a real increase in our SSA in four of the last six years.
== What’s this mean? ==
We wannabe retired and already retired have been tracking well above average returns over the last six years – actually more years than that. All of us have more now than we’ve ever had in our lives. Prospective retirement looks terrific. Actual retirement is better than terrific.
Conclusion: Patti and I closed our calculation year with a real increase in our Safe Spending Amount (SSA) – a real pay raise, in effect – of about 8% for our spending in 2021. This is the fourth increase in the last six years. Over six years our SSA has increased by 32% in real spending power. Despite six years of withdrawals, we have roughly 20% more portfolio value than we had before our first withdrawal six years ago.