How much did tax schedules adjust for inflation?
Posted on October 28, 2022
Last week the news reported that the IRS announced the tax schedules for 2023 and some reports stated, “Some will be able to keep more money.” I think you’ve got this: this last statement isn’t true. Accurate inflation adjustment of the tax tables mean that if your ordinary income is the same in real terms in 2023 as in 2022, you will pay the same real amount of tax. You’re not paying the IRS more because of inflation; your taxes are the same measured in spending power; the amount you keep is the same real spending power. The purpose of this post is to describe the two tax tables that adjusted for inflation.
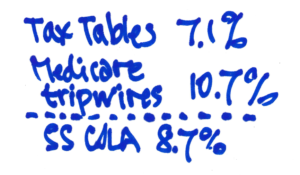
== The ordinary tax table: 7.1% ==
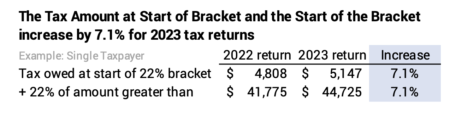
The IRS adjusted the 2023 tax table for ordinary income for 7.1% inflation; this compares to the 3.1% increase last year. The ordinary tax table applies to income other than that taxed at capital gains rates. For example, the standard deduction for a single tax payer increased from $12,950 to $13,850: that’s an increase nearest to 7.1% when rounding to the nearest $50. The tax tables all adjusted by 7.1%. For example, the start of the 22% tax bracket and the amount a taxpayer owes at the start of the 22% bracket increased by 7.1%.
== Is 7.1% the correct measure of inflation? ==
Why the 7.1% increase when all the reports are that inflation has increased by more than 8% over the past year? Does the IRS adjustment really reflect the inflation we experience? I can’t give clear answers.
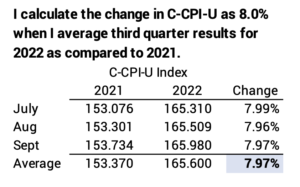
The IRS by law must use a different measure of inflation than we normally consider. It’s called the Chained Consumer Price Index for All Urban Consumers (C-CPI-U). It tries to account for the most current shifts consumer buying habits: when beef prices rise, more consumers will buy less costly chicken. The C-CPI-U reflects these shifts in the market basket of goods that consumers buy more quickly than other more commonly used measures of inflation: CPI-U or CPI-W. The C-CPI-U calculates a lower inflation than CPI-U or CPI-W. You can watch a five-minute video explanation here.
I don’t understand how the IRS uses the C-CPI-U index to calculate 7.1%. When I use a recent quarterly average of the index from here, I calculate an 8.0% increase.
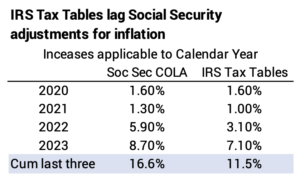
Over the past three years, IRS adjustments trail the adjustments for Cost of Living calculated by Social Security. The lag is about five percentage points. If the IRS adjustment is lower than the inflation we are experiencing, we have what some call “bracket creep”: we’re paying taxes on inflation: as measured in real spending power, we’re paying more in tax and we’re keeping less. Alternatively if Social Security is paying us more than the inflation we are experiencing, we’re really paying in less tax and keeping more in spending power.
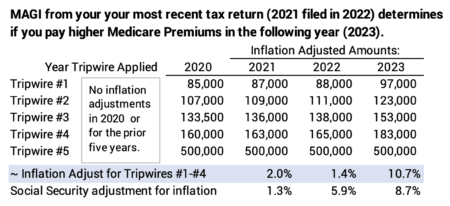
== Medicare Premium Tripwires: 10.7% ==
Medicare issues a table of tripwires in income – for most all of us that’s the same as Adjusted Gross Income, line 11 of your 2021 tax return as an example – that trigger higher Medicare Premiums. Cross the first tripwire of income by $1 and you could pay about $1,000 in added Medicare Premiums. Married, joint filers who receive Medicare would pay $2,000 in added premiums. For most of us retirees, the base Medicare B premiums and any added premiums are deducted from our Social Security benefits.
The tripwires issued by Medicare in September increased by 10.7%. I do not know exactly what Medicare uses for its calculation, since the recent adjustments do not track with recent measures of inflation. Perhaps the 10.7% inflation increase was catching up from last year’s low adjustment – or to make up for many prior years of no adjustment for inflation.
I’ll use the table just issued as input to my tax plan for 2022 that I will finalize next month. I’ll calculate our Adjusted Gross Income given our RMD and taxes on sales of other securities I’ll have to sell to add to the total we’ll withdraw from our nest egg for our spending. If I think I can avoid a tripwire, I’ll change what I sell for our spending in the upcoming: selling from my Roth results in no taxable income, for example.
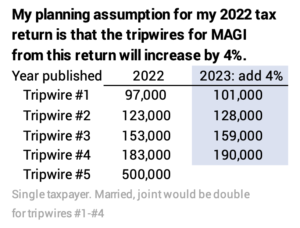
I revised the planning template that I first provided in this post last August. Here’s the revision. I have a very good view – not a perfect view – of the the table of tripwires that will be issued next September that will apply to my 2022 return. My planning assumption is the tripwires will increase by 4% for inflation next year; I’d double the tripwires displayed below for Patti and me as joint, married filers.
Conclusion. The IRS issued tax tables that will apply to your 2023 tax return. Everything increased by 7.1%. If that is the exact right measure of inflation, we all will pay the same, real amount of tax and keep the same, real amount after tax for our spending. The 7.1% increase is based on a different measure of inflation than used by Social Security for its Cost of Living Adjustment: 8.7% for the benefits in 2023.
Medicare increased by 10.7% the tripwires of income that can trigger higher Medicare premiums. This increase is greater than other measures of inflation. It may have increased that much since prior adjustments have been far lower than any measure of inflation. I always calculate my Adjusted Gross Income in November for our current-year tax return to make sure I don’t cross a tripwire that I can avoid.